


Most quality professionals working with surface texture/roughness are well familiar with the “R” parameters, such as Ra (average roughness). These widely used parameters are derived from 2-dimensional measurements, typically generated by stylus profilers or other 2D measurement technologies.
 Donald Cohen, PhDConfusion may arise when someone begins working with a new instrument or process that requires the use of “S” parameters, which are specific to areal (3D) measurements. This article gives some background into these two sets of parameters and discusses some of the important differences that may arise when transitioning from using one set to the other.
A Brief History of Surface Roughness Parameters
Early surface measurements were essentially derived from record player technology: a stylus moved across a surface, and a capacitor and diode converted the output signal into a DC value to drive an indicator needle. The average of the rectified AC signal was the “average roughness,” abbreviated “Ra.” Adding a few more electronic components netted the RMS (root-mean-square) roughness. These two parameters were the essential components of surface texture analysis for several decades.
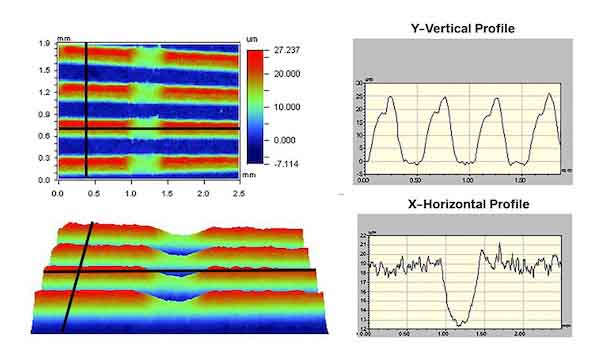 Figure 1. The 2D profiles on the right show slices across the areal (3D) data on the left, in the Y and X directions. R parameters describe the 2D profile data; S parameters describe the areal (3D) data.
 Mike ZecchinoAs measurement technology matured it became apparent that surface roughness is not always random nor consistent in all directions. Texture was found to consist of a spectrum of features with different spacings—a spectrum of spatial frequencies/wavelengths—that can impact a surface’s function in different ways. The concept of “filtering” was introduced (again, using resistors and capacitors) to highlight shorter or longer spatial wavelengths. We could now think of shorter wavelength “roughness” and longer wavelength “waviness” and “form” as different regimes which might need to be controlled independently.
In the 1980s and 1990s a leap in computer power greatly increased our ability to analyze surface data. A wealth of new R parameters were developed to distinguish more specific aspects of surface texture. Concurrently, standards committees began formalizing these parameters to give them universal meaning.
The Development of S Parameters
During this same period, instruments were being developed that could acquire “areal” data, gathering swaths of data optically rather than single traces mechanically (Figure 2). The 3D data was a boon for advancing our understanding of how surface texture affects component function.
Instrument developers and users, however, were faced with a new challenge. R parameters had always referred to 2-dimensional measurements; 3D data would provide different answers because the measurement regions differed in size, and the measurement equipment itself interacted differently with the surface.
The need had arisen for native, 3D parameters which could accurately described areal measurement data. S parameters were developed to provide 3D analogs to common R parameters. The designation “S” was chosen to indicate “surface.” Going further, new texture parameters were developed that could describe 3-dimensional aspects of the data that were not distinguishable by the R parameters (Figure 3).
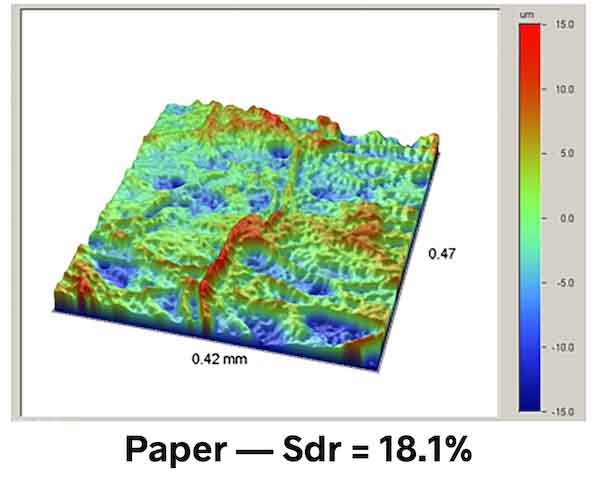 Figure 3. S parameters better described 3D measurement data and made it possible to describe and control complex aspects of surfaces. Sdr (shown here) is an advanced areal (3D) parameter that denotes the amount of additional surface area contributed by the texture, as compared to a perfectly flat surface of the same cross-sectional area.
Both R and S Parameters Have Important Functions
Fundamentally, R parameters describe data derived from a 2-dimensional profile, and S parameters describe data measured over an area of the surface. In the latter case, we tend to use the term “areal” instead of “3D,” as 3D often refers to dimensional measurements rather than texture measurements.
That distinction (R parameters for 2D versus S parameters for 3D) is unfortunately not quite so simple. Many stylus profilers can now acquire and assemble multiple traces into a 3D dataset from which S parameters can be calculated. And, areal measurement systems and software typically include cross-sectional tools that let the user analyze a 2D trace through the 3D data in order to output R parameters.
One last wrinkle: older 3D instruments built before the development of S parameters may output “R” parameters based not on one trace but on the entire 3D dataset. This allowed users of the new equipment to still produce numbers for the R parameters called out on prints. The data from these calculations may correlate to, but will not necessarily match, the output of stylus profilers. Differences in measurement sources and calculations can, therefore, lead to misleading results without some careful consideration.
Differences Between R and S Parameters
Some important distinctions should be noted when considering the R and S parameters.
1. Roughness vs Waviness
Those who have worked with 2-dimensional surface measurement instruments are likely familiar with roughness and waviness profiles which display shorter and longer spatial wavelengths. These profiles are defined by applying cutoff filters at particular spatial wavelengths. The choice of the cutoff wavelengths are not absolute values: they are, instead, defined by the application and the size of the features of interest for a particular application. What is considered “rough” vs “wavy” for a high-grade optical surface, for example, will differ from those values for a gear.
Figure 4 shows a raw, measured 2D profile at the top. In the second plot, the shortest wavelengths (instrument noise, etc.) below the cutoff λs have been removed, resulting in the primary profile. The roughness profile is then defined to include spatial wavelengths between two particular cutoff wavelengths, λs and λc, and the waviness profile between the cutoff wavelengths λc and λf. This type of analysis is very common in the 2D measurement world.
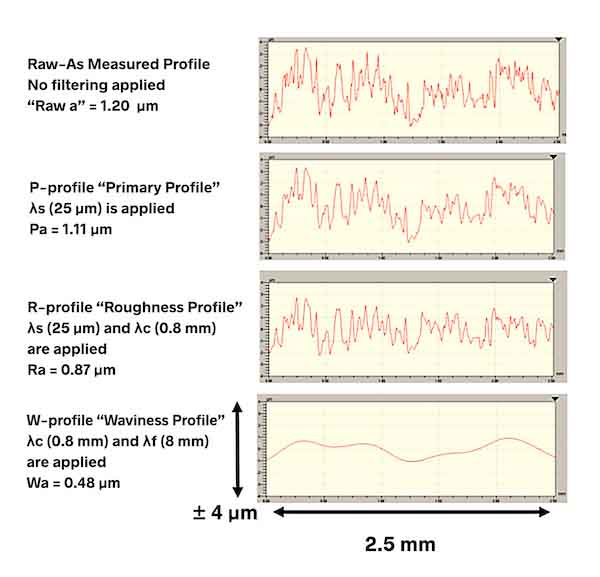 Figure 4. Primary, roughness and waviness are key concepts in 2D profiling but are not as well defined in 3D measurement data.
The concepts of a “roughness profile” or “waviness profile” do not translate into the 3-dimensional world, however. We still filter areal (3D) data to examine particular wavelength regimes, but for S parameters it makes more sense to describe “amplitude within a bandwidth” rather than to use terms such as “roughness” or “waviness.” The concepts are similar, but the distinction can lead to confusion.
2. Directionality
One of the reasons Sa and Ra do not always correlate is that a surface may have strong texture undulations in one direction but not another. Depending on the direction of the 2D trace, a profile measurement may be dominated by that texture, or it may miss it completely. An areal 3D measurement captures texture in all directions, which means S parameters are less susceptible to changes in the orientation of the part relative to the instrument.
The texture in Figure 5 has strong texture in two directions. The S parameters will produce similar numbers for this data regardless of the orientation in the field of view. It would be challenging, however, to choose a 2D profile direction that would reliably produce values that correlate with the areal measurement.
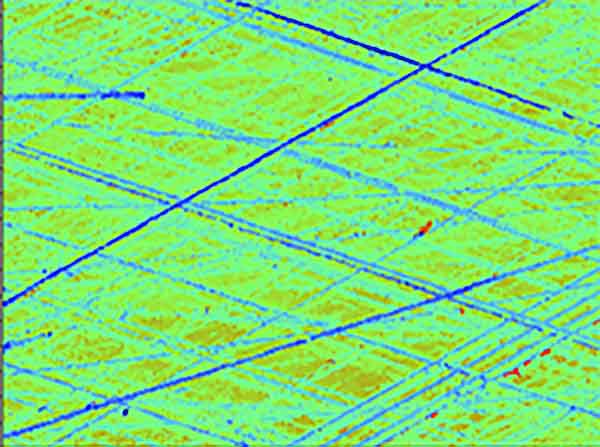 Figure 5. The cross-hatch pattern is clear and well defined in this 3D measurement. A 2D trace across the data would not give as clear an image of the overall texture and would be highly subject to the direction of the scan relative to the surface.
3. Scale
it is common for a stylus profiler trace to cover tens or hundreds of millimeters in length. A 3D optical profiler measurement may appear as a vast landscape of data on-screen, yet in reality the entire field of view may only cover a few square millimeters in area. A long stylus trace may therefore produce a more accurate measurement of long spatial wavelength waviness that is too large to capture in a single 3D measurement. Stitching methods do allow 3D measurements to be combined into much larger areas, though acquisition time can be quite long.
In any case, the size of the features and spatial wavelengths of importance dictate the type of measurement, and the parameters, that are the most meaningful for a given application.
4. Accuracy
As we mentioned earlier, S parameters are less susceptible to part alignment which can lead to more repeatable measurements.
It is also important to remember that different measurement technologies will acquire the underlying data differently as well, which can lead to differences in accuracy. A stylus encountering a high peak (Figure 6) may deflect around it rather than passing over it, thereby distorting the peak in the measurement or missing it altogether. The numerical aperture of an optical profiler’s objective may limit the maximum slope of surface features that can be imaged.
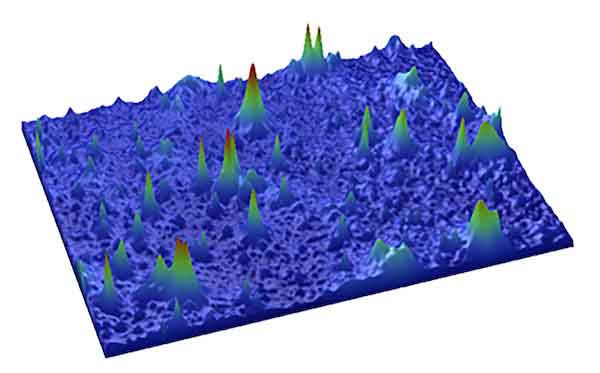 Figure 6. A stylus profiler may deflect around these peaks rather than passing over them. Optical profilers have different limitations.
5. Quantify functionality rather than the mathematical shape of the surface
The original set of R parameters were very much mathematical descriptions of the surface. As 3D surface texture analysis has progressed, an increasing number of parameters have been developed that describe how a surface performs its function. We can describe “functional” aspects of a surface, such as how well a surface may seal, as in Figure 7. “Hybrid parameters” can provide information regarding the aesthetic qualities of a finish, or the ability of packaging film to release cleanly, as in Figure 8.
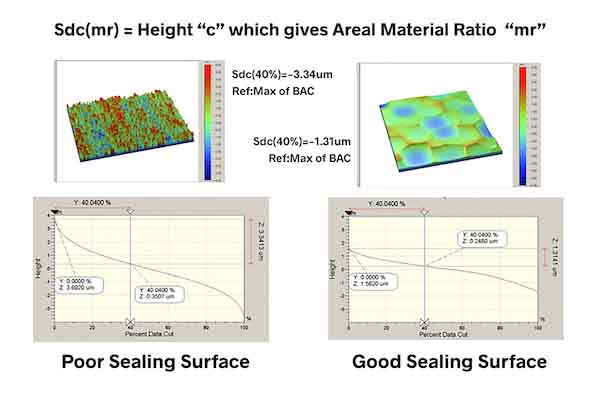 Figure 7. Parameters can be derived from areal 3D measurement data to describe functions. In this case, the Sdc(mr) parameter—a measure of the depth that a gasket may need to deform in order to provide adequate sealing—can be used to optimize a surface to entrap sufficient lubricant while also providing a good seal.
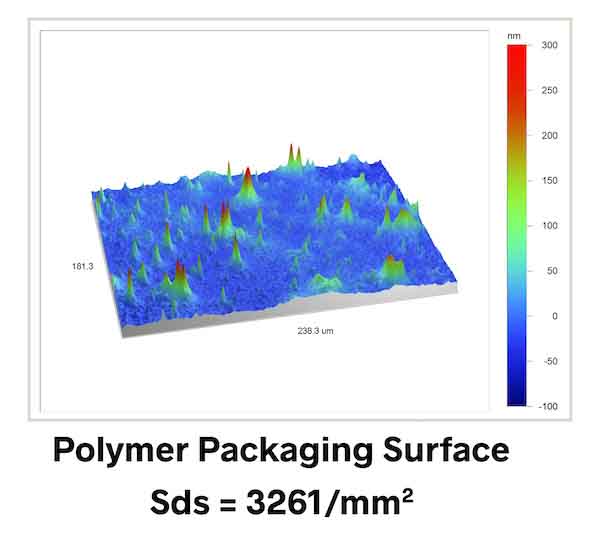 Figure 8. Here is another example of 3D texture parameters describing functionality. In this case, Sds (the Summit Density) can be monitored to track how well a packaging film will release from itself on a roll.
Ultimately, both the R parameters and S parameters play important roles in surface texture analysis. The key to working with both is to appreciate the information that each can, and cannot, tell us, based on the measurement data used to calculate them. A glossary of both R and S surface texture parameters is available at michmet.com/Texture_parameters.htm
Donald Cohen, Ph.D. and Mike Zecchino are with Michigan Metrology, which provides measurement services, consulting and training to address issues related to surface roughness, wear, texture, finish, flatness and more. Visit https://michmet.com