


Electrodeposition of silver from a bath of an alkaline cyanide has been carried out by applying pulsed current electrolysis.
 Pierre-Antoine Gay, Dr. Patrice Berçot, and Prof. Jacques Pagetti.A close comparison of some properties was made with coatings obtained with direct current. Particularly, tarnish resistance, wear resistance and hardness have been investigated. For more details, the specific pulse plating parameters are shown with the results.
Silver coatings degradation results from the formation of silver sulfide (Ag2S). Tarnishing of silver and its alloys remains the main limit of the jewelry and gold market for silver-plated products. This work, performed in collaboration with the Centre Technique de l’Industrie Horlogere,1 studies the realization and characterization of bright silver coatings obtained by pulsed currents. The purpose was to improve some surface properties, and particularly to limit the aggressive effects of tarnishing that tend to diminish the storage periods of pure silver or silver-covered alloys.
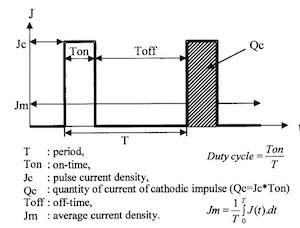 Fig. 1—Rectangular pulse shape of plating current.By pulsing the plating current, it is possible to exercise greater control over the properties of electrodeposits and to improve them; in particular, properties such as smoothness,1 brightness,2, 3 adherence,4 abrasion resistance and solution efficiency.5
Square-wave pulses, in which the plating current is on for a given time and no current flows for a certain interval, are most often used. Better control over the properties of deposits results because it is possible to vary independently the current density, the pulse frequency and the duty cycle, which is the ratio of the on-time (Ton) to the sum of the on-time and the off-time (Toff):
[(Duty cycle) = (Ton)/(Ton + Toff)] 1,6,7,8
Pulse plating technique uses interrupted currents; the most frequently used, according to the literature, have a rectangular pulse shape as shown in Fig.1.
Note: This paper was published in 2002.
Electrochemical Procedure
The plating solution was a standard silver cyanide bath containing 7.5 g/L KOH, 30 g/L K2CO3, 125 g/L KCN, 60g/ L KAg(CN)2, 10 mL/L NH3, 0.75g/L (NH4)2S2O3. Deposition was carried out at a current density of 0.5 A/dm2, pH 11.6 ±1 at room temperature in aerated solution stirred with a magnetic bar at a speed of 250 rpm. To study the influence of pulse plating, deposits were also realized in direct current. The experimental device (Fig. 2) consisted of:
- A cell containing the plating solution.
- Two electrodes immersed in the bath: one anode (CE) made of 99.99 percent silver and one made of 2 cm brass plate placed as cathode (WE). Before plating, the brass plates were first degreased in an alkaline bath, rinsed in deionized water then etched in an acidic bath.
- A current generator driven by a computer.
- An oscilloscope to see the transitory curves V = f(t) responses to the current impulses.
All potentials were referred to a saturated calomel electrode (SCE).
To compare the results, the Jc and Ton parameters of the pulsed currents were varied, using a classical square-wave pulses without reverse pulses, the so-called pulsed currents “P.C.”. Maintenance times (Ton) are calculated in order to keep always the same average current density (Jm) equal to the current density used in D.C.
[(Jm) = (Jc * Ton)/(Ton + Toff)]
Experimental Results
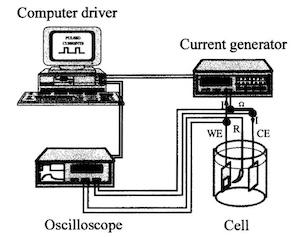 Fig. 2—Electrochemical device.Plating time is fitted to obtain coatings of constant thickness (10 m). The shape of the V vs. time curves,9 the responses to the current impulses, makes it possible to follow the progress of the various electrochemical processes established on the surface of the working electrode (WE).4
From these curves, it is possible to define experimentally the lower and higher limits that set up the faradaic ranges when only the charge transfer of the metal cations occurs. Figure 3 shows the faradaic range obtained with the cyanide silver bath, from which it is possible to fix the parameters related to the shapes of the current.
Operating conditions are then selected in the shaded zone on the faradaic range (Fig. 4), where two current quantities Q+ and Qare fixed. Q+ and Q(dotted lines) represent high and low levels of the cathodic impulse current quantity ( Q+ = 100 A·ms/dm2 and Q= 50 A·ms/dm2). The average of the experimental results obtained for seven tests performed under the same operating conditions are compiled in Table 1.
Table 1: Experimental Design for Pulsed Current
| Sample | Jc A/dm2 | Ton msec | Toff msec | Qc A msec/dm2 |
| PC1 | 5 | 10 | 90 | 50 |
| PC2 | 5 | 20 | 180 | 100 |
| PC3 | 10 | 5 | 95 | 50 |
| PC4 | 10 | 10 | 190 | 100 |
| PC5 | 20 | 2.5 | 97.5 | 50 |
| PC6 | 20 | 5 | 198.5 | 100 |
| PC7 | 30 | 1.7 | 98.3 | 50 |
| PC8 | 30 | 3.3 | 196.7 | 100 |
| PC9 | 50 | 1 | 99 | 50 |
| PC10 | 50 | 2 | 198 | 100 |
Tarnish Resistance
To study the tarnish resistance of coatings, we carried out the accelerated tarnishing thioacetamide test in accordance with the standard ISO 4538. It consists of exposing the sample to thioacetamide vapor in an atmosphere having a relative humidity of 75 percent, maintained by a sodium acetate solution. Regular observations of the sample after 1, 2, 4, and 8 hr, 1, 2, 4 and 8 days were made. The kinetics of tarnishing was studied via the CIELAB colorimetry technique,10, 11 which allows quantification of the color variation of the sample which is related to its tarnish resistance. Figure 5 illustrates the color basis of the CIELAB coordinates. The color coordinates a*, b* and L* were compared to a standard 92.5 percent silver whiteness by means of a computed color vector expressed as . This value represents the length of a color vector in three-dimensional space from the target point. The following relationship produced the vector magnitude:
Dab = Ö[(a2 -a1)2 + [(b2 -b1) 2 + [(L2 -L1) 2]
The lower the value of Dab, the shorter the vector translating into a closer color match to the silver standard. The silver standard values of a1* = 1, b1* = 2 and L*1 = 90 are indicative of bright silver. Figure 6 shows a schematic diagram of the cell in which the tarnishing tests were carried out at room temperature.
Results of the thioacetamide corrosion test are presented in the form of vector Dab vs. log (t) curves, where t indicates time in hr. The X-axis represents the time as a decimal logarithm and the Y-axis the variation of color vector (Dab). The plot in Fig. 7 shows a tarnishing curve obtained on a solid silver plate .925 fine. Point K corresponds to the first point of inflection on the curve. This point locates the silver tarnish starting time, which occurs after seven hr of exposure.
Table 2: Results of Tarnish Tests
| Operating Conditions | Tarnish Starting Time hr |
| Solid silver (.925 fine) | 7:00 |
| DC | 7:10 |
| PC1 | 8:45 |
| PC2 | 8:30 |
| PC3 | 8:30 |
| PC4 | 9:00 |
| PC5 | 8:50 |
| PC6 | 7:50 |
| PC7 | 8:00 |
| PC8 | 7:40 |
| PC9 | 7:50 |
| PC10 | 7:50 |
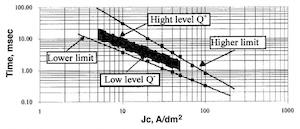 Fig. 4—Operating conditions in the Faradaic range.Table 2 lists the various results of the tarnishing tests on silver coatings carried out with pulsed and direct currents. A solid silver sample .925 fine was used as a reference. Taking into account results obtained during the tarnish test, Fig. 8 shows the increase in tarnish resistance compared to solid silver. In all cases, pulse-plated deposits increased tarnish resistance. This result obtained with pulsed current ranged between protection by burnishing (K = 8.2hr), which corresponds to an increase in tarnish resistance of 19 percent and the classical chromate passivation (K = 24.4 hr), which corresponds to an increase in tarnish resistance of 250 percent. In addition, it appears that two groups of coatings can be distinguished; PC1 up to PC5 and PC6 up to PC10. The first shows an increase in tarnish resistance of about 25 percent and the second an increase in tarnish resistance of 10 percent. Plotting the increase in tarnish resistance (%) vs. the current density Jc for the two levels Q+ and Qof cathodic current quantities, it is possible to correlate the increase in tarnish resistance with the peak density (Fig. 9).
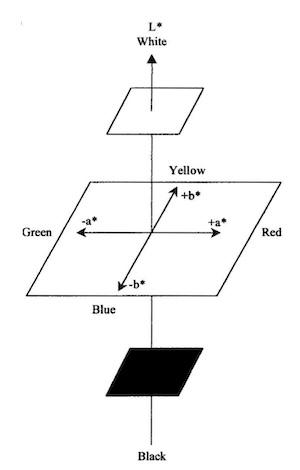 Fig. 5—CIELAB color coordinates system for objective quantification of color.11For the lowest current densities, from 5 A/dm2 to 10A/dm2, the increase in tarnish resistance is about 25 percent. For the highest current densities, from 30 A/dm2 to 50 A/dm2, the increase in tarnish resistance is about 10 percent. At medium current density (20 A/dm2), two different results were obtained. For highlevel Q+ (PC6), the increase in tarnish resistance is similar to results obtained at highest current densities (10%). For lowlevel Q(PC5), the increased tarnish resistance is similar to results obtained at lowest current densities (25%).
To explain the increase in tarnish resistance, in relationship with Q+ and Q-, the morphology of the coatings was examined by scanning electron microscope (SEM).
Morphology of Silver Deposits
Typical SEM 3 photographs of silver deposits obtained with direct current produced a bright and smooth surface, as shown in Fig. 10. It appears that the epitaxial growth of silver electrodeposits can be obtained with DC at a current density of 0.5 A/dm . Figure 11 shows the effect of pulsed current on the grain formation of silver in the deposits for various operating conditions PC1, PC5, PC6 and PC10.
Coatings formed at PC 1 with current density of 5 A/dm2 and Qof 50 A·ms/dm2 are nodular, the so-called ‘cauliflower-like’ appearance. The average grain size is 3.5 m. With the PC5 conditions, the nodular ‘cauliflower-like’ structure tends to disappear, leaving a smooth granular and compact structure. It appears to result from an increase in nucleus generation rate. The average grain size is close to PC1 grain size (3.5 m). PC6 deposits show a granular and compact structure with an average grain size of 2 m. PC10 conditions result in an identical structure with more nucleus generation and compact, fine-grained appearance. In this latter case, the grain size is the same (2 m). Different results obtained with PC5 and PC6 in the tarnish test can be explained by a progressive transition of microscopic structure from a similar ‘cauliflower-like’ structure to a fine-grained compact structure. According to these results, it appears that coatings having a mixture of nodular ‘cauliflower-like’ and compact structure exhibit the best increase in tarnish resistance than those having only a fine-grained compact structure.
Friction Tests
To test the tribological properties of the coatings deposited by pulsed currents, we used a pin/plan tribometer (Fig. 12). During the test, the samples had an angular velocity of 10.5 rad/sec. The wiper was a 10-mm diameter steel 100C6 ball with a load of 300 g. The stainless steel force sensor was a beam with an embedded rectangular section. The deflection of the blade is proportional to the coefficient of friction generated in the contact. This latter is measured by stress gauges . The signal delivered by the gauges was digitized and stored in a microcomputer that controls the unit. The average coefficient of friction evolution is measured according to the number of cycles.
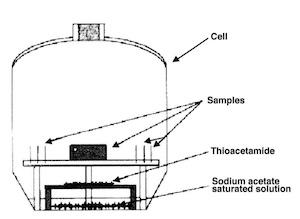
Fig. 6—Tarnishing cell.

Fig. 7—Accelerated tarnishing test on .925 fine silver.
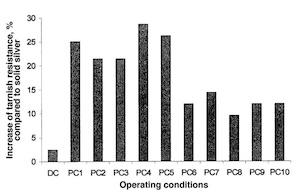
Fig. 8—Increased tarnish resistance (%) compared to solid silver for different operating conditions.
Figure 13 shows the comparison of the tribological tests obtained with DC and PC1 deposits, (i.e., Jc = 5 A/dm2 and Ton = 10 ms). The latter shows the lowest coefficient of friction. In this case, the coefficient is about 0.13; that is, approximately four times weaker than that obtained for coatings carried out under DC (0.50).
The silver coefficient of friction (Fig. 14) can be decreased significantly using a low Jc and a short Ton that correspond to the Q– level in the experimental design. By increasing the current density Jc and keeping a low Ton, the coefficient of friction tends toward a value close to that obtained under DC. Conversely, the coefficient of friction tends to decrease with a high Ton corresponding to the Q+ level (PC10 operating conditions).
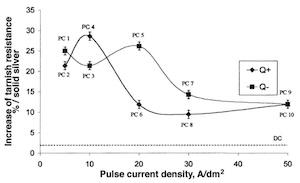
Fig. 9—Interaction between pulse current density (Jc) and current densities Q+ and Qvs. increase of tarnish resistance.
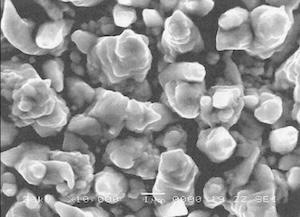
Fig. 10—Deposit morphology at 0.5 A/dm2 DC.
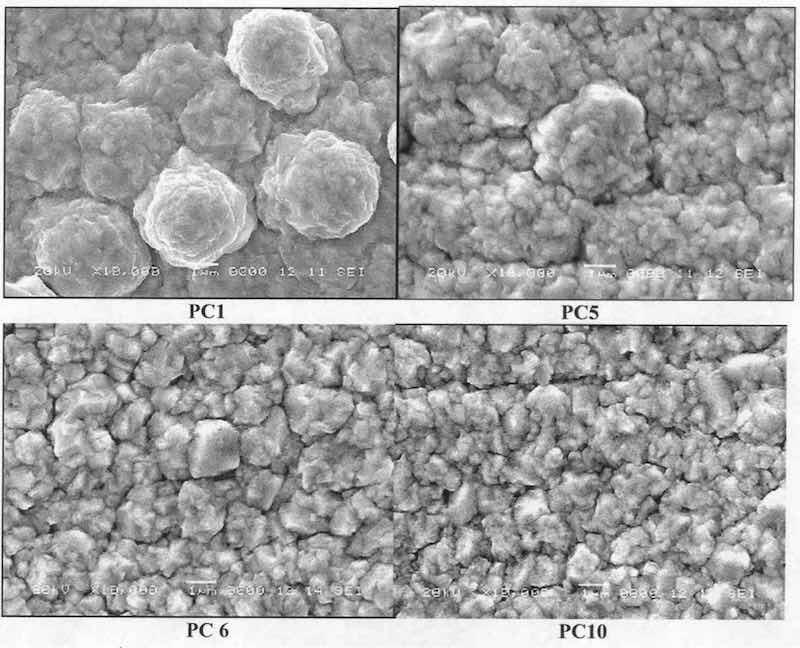
Fig. 11—Deposit morphology with pulsed current at various operating conditions (PC1, PC5, PC6, PC10).
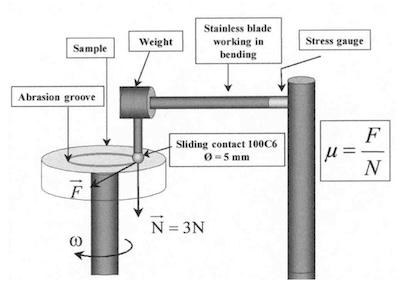
Fig. 12—Diagram of the tribometer pin/plan.
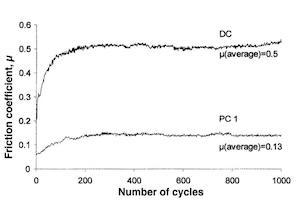
Fig. 13—Coefficients of friction; comparison between PC1 and DC.
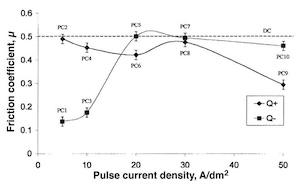
Fig. 14—Interaction of pulse current density/impulse current quantity and friction coefficient.
Conclusions
This study showed the influence of pulse plating on the characteristics of bright silver deposits. Generally, coatings obtained by pulsed currents exhibit better resistance to tarnishing than those obtained with DC (with a minimum improvement of about 10 percent). Coatings obtained with a Jc below 20 A/dm2 show an increase in tarnish resistance ranging from 20 to 25 percent. At 20 A/dm2, the morphology of coatings changes with the quantity of current. For low quantity of current (Q–), ‘cauliflower-like’ nodules with granular structure are observed. In this case, the increase in tarnish resistance was close to 25 percent. For the high quantity of current (Q+), the deposits are granular and compact. The increase in tarnish resistance was then close to 12 percent. Coatings elaborated with higher Jc show an increase in tarnish resistance close to 10 percent.
Low Jc and low Ton pulse plating parameters enhance tribological characteristics. In this way, the coefficient of silver friction can be decreased considerably, from 0.50 (DC) to 0.13 (PC1).
From these results, it is possible to find a compromise in which tarnishing resistance and lower friction coefficient are obtained. With PC1 and PC3 conditions, it is possible to increase tarnish resistance about 20 percent and to obtain a coefficient of friction lower than 0.2.
About the Authors
Pierre-Antoine Gay is a doctoral candidate at the Laboratory of Corrosion and Surface Treatments of the University of Franche-Comté, 16 Route de Gray 25030 BESANÇON Cedex France. He holds a DEA degree in material and surface science from the University of Franche-Comté. Dr. Patrice Berçot is an engineer and the supervisor of the research team for pulsed currents and composite coatings at the Laboratory of Corrosion and Surface Treatments of the University of Franche-Comté. He is also Professor at the Superior National School of Mechanics and Microtechniques, Besançon Cedex France. Prof. Jacques Pagetti is a professor at the Laboratory of Corrosion and Surface Treatments of the University of Franche-Comté. He is a specialist in electrochemistry, corrosion, metallurgy and surface treatments.
Acknowledgment: The authors thank CETEHOR for financial support and technical help in this study.
References
- J.C. Puippe, N. Ibl, H. Angerer & H.J. Shenk, OberflächeSurface, 4, 77 (1979).
- P. Berçot, G. Messin & J. Pagetti, Communication SFME, 22 Mai Bordeaux (1987).
- W. Reksc, K. Jurewicz & E. Frackowiak, Plat. and Surf. Fin., 76, 114 (May 1989).
- P. Bercot, Thesis, Université de Franche Comté, Besançon, 1988.
- A. Knodler & C.J. Raub, Gold Bull., 10, 38 (1977).
- N. Ibl, Proc. 10th World Congress on Met. Fin., Shiro Haruyama, Ed., Kyoto, Japan (1980).
- J.C. Puippe, Plat. and Surf. Fin., 20, 68 (1980).
- N. Ibl, J.C. Puippe & H. Angerer, Surface Technol., 6, 287 (1979).
- P. Berçot, B. Lang & J. Pagetti, Matériaux et Techniques, 8-9, 3 (1994).
- G. Normandeau & R. Roeterink, Gold Bull., 27(3), 70 (1994).
- R. German, M. Guzowski & D. Wright, Gold Bull., 13(3), 113 (1980).
- D. Chicot & J. Lesage, Matériaux et Techniques, 19, 10 (1994).