


Nickel coatings are widely used for corrosion and wear resistance, often undergoing post-treatment to enhance performance.
 Arash Azimi Dastgerdi, Ehsan Rahimi, Prasad Gonugunta, Prasaanth Ravi Anusuyadevi, Ricardo Bouwer, and Yaiza Gonzalez-Garcia.Depending on their final application, Ni-coated steel may be subjected to mechanical forming processes to produce cylindrical can shapes, commonly used as battery cases or food storage containers where corrosion resistance is critical. Before mechanical forming, a key thermomechanical process called temper rolling is applied to improve coating adhesion, reduce residual stress, and minimize surface defects. This study systematically investigates the corrosion mechanisms of Ni-electroplated steel after annealing and temper rolling, demonstrating that both processes enhance localized corrosion resistance by modifying microstructure, surface morphology, and surface oxide evolution.
These treatments promote passivity by increasing NiO content relative to Ni(OH)2, significantly improving charge transfer resistance. Additionally, iron diffusion from the steel substrate generates an electrical surface potential gradient within the coating, affecting nobility variations across different regions. Post-corrosion analysis of temper-rolled samples reveals that corrosion initiation occurs at submicron grains, where structural gaps facilitate substrate exposure, underscoring the role of processing routes in enhancing coating durability.
Note: this article's original title is "The effect of combined annealing and temper-rolling treatments on the microstructure and corrosion properties of nickel electroplated coating."
1. Introduction
Metallic coatings play a crucial role in both practical applications and technological advancements, serving as essential functional or protective surface treatments in our daily lives [1,2]. Corrosion-resistant coatings are effective in preventing unwanted corrosion of various materials [[3], [4], [5], [6]]. Nickel coatings are commonly used to create protective coatings in various applications, offering strong mechanical properties, thermal stability and corrosion resistance to the underlying steel [[7], [8], [9], [10], [11], [12]].
Electrodeposition, also known as electroplating, has been widely used in industry due to its versatility and cost-effectiveness. This process results in nano/submicro-crystalline microstructures within the deposited coating [13,14]. Electroplating enables control over the microstructure by adjusting deposition parameters such as solution pH, bath temperature, and applied current density or even application of different electrodeposition methods [[15], [16], [17], [18]]. For instance, different deposition current densities can influence the surface morphology and roughness [19] and modify the grain orientation and texture of the microstructure [17]. In nanocrystalline coatings, grain boundaries constitute a significant portion of the material's volume.
The corrosion performance of the Ni coatings is also influenced by the microstructural changes. Recent studies have highlighted the enhanced pitting resistance of nickel electroplated coatings with high-density nanoscale twins when exposed to NaCl solutions of varying concentrations (0.02–0.10 M) [20]. Additionally, Meng et al., showed that coatings with a 50 nm grain size demonstrate superior corrosion resistance compared to those with 10 nm grains in a buffer solution containing 0.02 M NaCl (pH 8.4), likely attributed to the presence of larger nanoscale twins [21]. Nanocrystalline Ni coatings exhibit improved corrosion resistance, as they form a more continuous passive layer in NaOH [22] and NaCl [23] solutions due to their higher grain boundary density compared to microcrystalline Ni coatings [24]. It has been reported that the breakdown potential of nanocrystalline Ni coatings improves with a mixed surface morphology of pyramids and blocks compared to a spherical morphology in NaCl solution [25]. Some findings suggest that the increase in (111) orientation plane in nanocrystalline pure nickel enhances corrosion resistance, regardless of grain size [26].
However, defects such as pinholes in electroplated Ni coatings can compromise their durability and corrosion resistance [27]. Modification methods can enhance coating performance, but their effects vary with the coating type. For instance, ultrasonic impact treatment improves the corrosion resistance of CrMnFeCoNi high-entropy alloy coatings [28], but increases corrosion susceptibility in 30 %WC-Ni coatings [29]. Likewise, temperature field-assisted laser cladding reduces galvanic corrosion in CrMnFeCoNi coatings [30].
It is important to note that various efforts have been made to improve the performance of these coatings through modifications. It has been well established that modified coatings containing embedded particles, such as Mo [31], Co [32], and P [33], exhibit excellent corrosion resistance. Moreover, multilayer coatings have demonstrated superior corrosion resistance compared to single-layer coatings. For instance, Ni/Ni multilayers can prevent the formation of through-thickness pinholes, thereby enhancing their protective performance in NaCl solution [27]. Similarly, Cr/Ni multilayers with Ni as the top coating exhibit better corrosion resistance in 0.1 M H2SO4 solution than individual Cr or Ni coatings [34]. Other investigations focused on the characterization and corrosion behaviour of the electrodeposited nickel alloys as the coating of interest. It has been reported that the surface morphology and microstructure of Ni–Co alloys vary with cobalt content. The Ni–20 % Co alloy exhibits superior corrosion resistance in a NaCl solution compared to other Ni–Co alloys, as well as pure cobalt and nickel coatings [35].
In addition to these modifications, processing treatments like annealing and rolling are commonly used to enhance microstructure, mechanical properties, and corrosion resistance. In the case of Ni coatings, the influence of annealing treatment on microstructure and corrosion behaviour has been investigated extensively [[34], [35], [36], [37], [38], [39], [40], [41], [42], [43]]. On the contrary, some research has been conducted on the temper rolling process of steels [[36], [37], [38], [39]]; however, none has focused explicitly on Ni-coated steel.
Annealing at adequate temperatures can modify the phase composition, crystallite size, and residual stresses of electrodeposited coatings, leading to microstructural changes that improve properties like hardness, wear resistance, and corrosion resistance [[40], [41], [42]]. Annealing has been reported to influence the crystallite texture in nickel coatings [43,44]. For example, in situ TEM annealing of a thick (5 mm) Ni electrodeposited coating (200–600 °C for 20 min) revealed a surface texture change from 〈110〉 to 〈100〉 and 〈111〉 [45]. These low surface energy planes can improve surface oxidation resistance [46]. Improvements in properties after annealing may result not only from changes in crystallite size or phase composition but also from the evolution of grain boundaries during annealing [44,47]. Randle et al. [48] studied annealing twins in 99.5 % pure nickel, annealed in air at 825–1050 °C for 6 h, and found that the Σ3 fraction stabilized, indicating twinning occurs independently of grain growth. Meng et al. [49] found that annealing nanocrystalline Ni coatings at 200 °C for 10 min produced a higher twin density, while annealing at 400 °C promoted greater grain growth but reduced twin density. Corrosion tests in a buffer solution with 0.02 mol/L NaCl revealed that coatings annealed at 200 °C exhibited better corrosion resistance, highlighting the greater influence of twin density over grain size. Following annealing, temper rolling is applied to refine mechanical properties further. This process is essential for industrial applications, as it enhances the hardness and ductility of the coated steel, ensuring that it can withstand forming and deep-drawing operations. Temper rolling also helps to eliminate any remaining surface defects, improving the overall coating quality required for battery can production.
It is worth noting that the corrosion behavior of alloyed Ni coatings after annealing has been a primary focus of many researchers. Research has shown that annealing Ni-26 wt% Mo alloy coatings improves corrosion performance in 0.5 M NaCl solution, attributed to the increased NiO oxide layer thickness at 400 °C and 600 °C after 1 h [50]. Similarly, annealing Ni-Mo alloy coatings at 200 °C, 400 °C, and 600 °C for 25 min demonstrated that the highest corrosion resistance in 10 wt% NaOH solution occurs at 600 °C [42].
As mentioned, most research has focused on improving the electroplated coating characteristics by adding alloying elements or layers to the coating. However, these methods are not usually economical or easy to apply, which makes them unfavourable for industrial production. Furthermore, less attention has been devoted to applying important processing methods, such as annealing or temper rolling. Very few studies have systematically investigated the chemical stability and corrosion performance of Ni-coated steel can batteries [51,52]. Despite their critical role in battery can manufacturing, the precise influence of annealing and temper rolling on the microstructural evolution and corrosion resistance of Ni coatings remains inadequately elucidated.
The present research investigates the changes in the microstructure in a Ni coating deposited on a low-carbon steel substrate throughout the processing route, from electroplating to temper-rolling. To achieve this, multiple characterization techniques were utilized, including scanning electron microscopy and energy dispersive spectroscopy (SEM/EDS), Electron Backscatter Diffraction (EBSD), Glow Discharge Optical Emission Spectroscopy (GDOES), and Electron Probe Micro-Analyzer (EPMA) for microstructure and surface morphology analysis, atomic force microscopy and scanning kelvin probe force microscopy (AFM/SKPFM) for topography and electronic surface potential assessments, and X-ray photoelectron spectroscopy (XPS) for analyzing oxide formation on the nickel surface. Furthermore, this work examines how these microstructural changes influence corrosion behaviour, focusing on the effects of the annealing process and subsequent temper-rolling. The corrosion performance of the Ni-coating was studied by using multi-electrochemical analyses, which included open-circuit potential (OCP), potentiodynamic polarization, and Electrochemical Impedance Spectroscopy (EIS) measurements during a short immersion time of 30 min in 0.1 M NaCl solution.
2. Experimental procedure
2.1. Materials
Samples of nickel-coated steel sheets produced by Tata Steel Europe company were utilized in this investigation. The substrate for the nickel coating was a cold-rolled, low-carbon steel sheet. Three types of nickel-coated samples were analyzed, representing different stages of production: electroplated, annealed, and temper-rolled. The electroplated samples were produced by electrodepositing nickel onto the surface of cold-rolled steel sheets, which continuously pass through a Watts nickel bath commercialized by Tata Steel Europe. Table 1 presents the chemical composition of the steel substrate. The steel substrate has a thickness of 0.6 mm, while the coating is 4 µm thick. The annealed samples were obtained by subjecting the electroplated sheets to a batch annealing process (T = 550 °C and time = 35 h). In contrast, the temper-rolled samples were produced by further temper-rolling the annealed sheets. The surface roughness (Ra) achieved by temper rolling is adjusted to fall within the range of 0.2 to 0.3 µm [53].
Table 1. Chemical composition of low carbon steel substrate.
| Element | C | Mn | Al | Cr | N | Fe |
| Weight percent | 0.04 | 0.20 | 0.045 | 0.04 | 0.003 | Balanced |
2.2. Microstructural characterization
During sample preparation, samples were cut to 2 × 2 cm for microstructural and electrochemical examinations. Samples of 1 × 1 cm were prepared for XPS analysis. The surfaces were ultrasonically cleaned with acetone and isopropanol. Visual inspection under a microscope was conducted to eliminate specimens with scratches or stains.
For cross-sectional evaluation, the samples were mounted in a conductive resin and their surface were prepared using SiC abrasive papers with grit sizes of 800, 1200, 2000, and 4000, followed by mechanical wet polishing to 1 µm with diamond paste. In order to observe Ni coating cross-section microstructure, specimens were etched in a solution containing 50 % of HNO3 and 50 % of CH3COOH.
For the evaluation of surface morphology and cross-section microstructure, scanning electron microscopy (SEM) was employed and their compositions were determined using energy dispersive spectroscopy (EDS) analysis (Zeiss Gemini 450 FEG-SEM). For high-resolution images, an acceleration voltage of 1.5 kV was used, and for EDS surface mappings, a voltage of 15 kV was applied. To assess the Ni coating texture and grains on the surface, the samples were measured after a short step polishing of the surface with colloidal silica (OPS) using a scanning electron microscope (Zeiss Ultra plus FEG-SEM) equipped with an Electron Backscatter Diffraction (EBSD) device (Oxford Instruments Symmetry S2 EBSD detector system). The acceleration voltage of 20 kV was used, and the EBSD scans were evaluated with Aztec Crystal 3.1 software (Oxford Instruments). Glow Discharge Optical Emission Spectroscopy (GDOES) and Electron Probe Microanalysis (EPMA) were employed to evaluate the diffusion profile and elemental distribution of the samples, respectively. The EPMA measurements were performed using a JEOL JXA 8900R microprobe with an electron beam energy of 10 keV and a beam current of 50nA, employing wavelength-dispersive spectrometry (WDS).
2.3. Topography and electronic surface potential analyses
Atomic force microscopy (AFM) and scanning Kelvin probe force microscopy (SKPFM) maps were conducted to assess the effects of annealing and mechanical treatment on the topography and surface potential of various nickel electrodeposited coatings. The AFM/SKPFM measurements were performed using a Dimension Edge device equipped with an n-type doped silicon pyramid single crystal tip coated with PtIr5 (SCM-Pit probe). Surface potential maps were captured using the dual-scan mode. During the first scan, surface topography was recorded in tapping mode. Subsequently, the tip was lifted to 50 nm for the second scan, during which the surface potential signal was measured while following the topography contour obtained in the initial scan. These measurements were conducted in ambient air at 22 °C with a relative humidity of approximately 40 %. The maps had a pixel resolution of 512 × 512, a zero-bias voltage, and a scan frequency of 0.3 Hz. An AC voltage with an amplitude of 6 V was applied to the tip during the scans.
2.4. X-ray Photoelectron Spectroscopy (XPS)
The oxides on the surface of the nickel coatings were analyzed using an X-ray Photoelectron Spectroscopy (XPS) PHI-TFA spectrometer (Physical Electronics Inc.), equipped with an aluminum (Al) non-monochromatic Kα X-ray source (hν = 1486.7 eV). The X-ray source operated at a power setting of 200 W with an accelerating electron voltage of 13.5 kV. XPS measurements were conducted under a vacuum of 9–10 mbar. The pass energy during the full survey measurement was set to 89.45 eV, while high-resolution measurements were performed with a pass energy of 71.55 eV. Spectra were collected at a take-off angle of 45° with a 400 µm beam diameter. XPS probed the sample surface to a depth of 3–5 nm.
2.5. Electrochemical analyses
Samples of 2 × 2 cm were cleaned with acetone. Copper tape was applied to the back of the specimens to serve as an electrical contact, and then anti-corrosion tape was applied to the surface to isolate the specimen and copper tape from the solution, ensuring an exposed area of 0.785 cm2 (circular section). Electrochemical measurements were performed using a BioLogic VSP-300 potentiostat. A three–electrode cell configuration consisting of the sample as working electrode, a platinum counter electrode, and a saturated Ag/AgCl/KClsat reference electrode was used for the experiments. All electrochemical tests were carried out on an aerated 0.1 M NaCl solution at room temperature (T = 18–22 °C), and pH 6.
Previous to potentiodynamic polarization and EIS measurements, specimens were immersed in the test solution and the Open-Circuit Potential (OCP) was monitored until stabilization (30 min). Potentiodynamic polarization tests were carried out using a potential scan rate of 0.167 mV/s according to the standards [54,55]. The initial potential was set at −0.1 V relative to the Open Circuit Potential (OCP). Ten specimens were tested for each of the electroplated, annealed, and temper-rolled samples. Electrochemical Impedance Spectroscopy (EIS) measurements were conducted starting from a frequency of 100 kHz down to 10 mHz, using an AC sine wave with a 10 mV amplitude. All the fittings were done by Zview(Tm) 4 software. Each measurement was repeated ten times for each sample.
3. Results and discussions
3.1. Characterization of surface coating morphology and microstructure
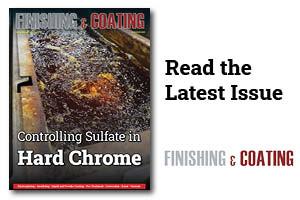
Fig. 1(a–c) shows the electroplated, annealed, and temper-rolled surface morphology. The deposited nickel forms patterns resembling valleys and hills, with the taller nickel grains on the hills. It follows the roughness pattern of the steel substrate. The temper rolling process generates a distinct surface pattern where the rolling action squeezes most grains while the rest remain unaffected. The resultant patterns from the rolling procedure vary depending on the roughness of the roll. In essence, if a shinier surface is desired, the roughness of the roll would be adjusted to facilitate more grains being compressed during temper rolling [53,56]. Nevertheless, these unaffected grains may exhibit variations in height compared to the adjacent compressed regions. This discrepancy could stem from fluctuations in the roughness of the roll, resulting in inconsistent contact with all grains, or from variations in the size and position of the grains themselves, which may reside within valleys or atop hills.
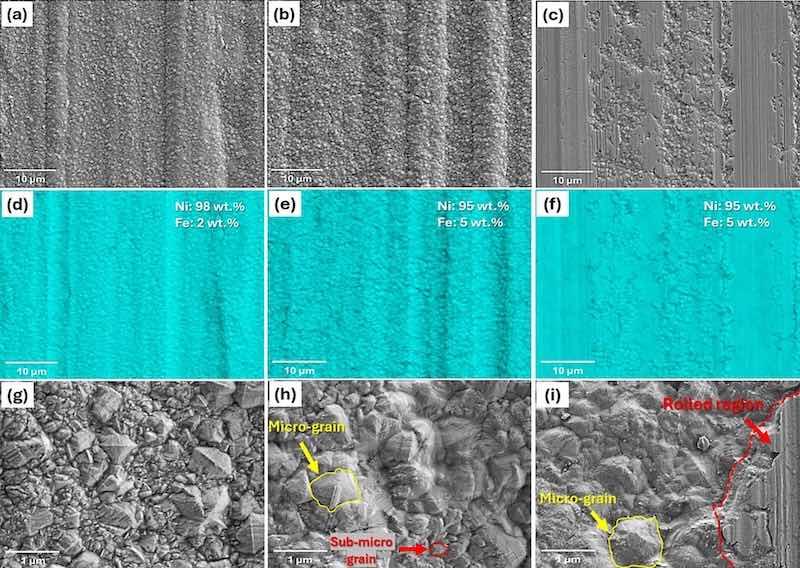
Fig. 1. Top-view low magnification, surface elemental map, and high magnification SEM images of different coated samples, including (a,d,g) electroplated, (b,e,h) annealed, (c,f,i) temper-rolled.
Fig. 1(d–f) illustrates the EDS elemental maps of Ni from the surface of all samples. They confirmed that the surfaces are entirely covered by Ni at the same coating thickness. However, small amounts of Fe are detected for all samples in a way that for the electroplated sample is about 2 wt% and for the annealed and temper-rolled is about 5 wt%, respectively. It should be noted that the detection of Fe may not be directly related to the result of the diffusion of iron from the substrate. It can originate from the steel substrate due to the high accelerating voltage (15 kV) that leads to extracting data from a greater depth. Fig. 1(g-i) evaluates the surface at a higher magnification. The grain size varies across the sample, ranging from nano to submicron-sized nickel grains (Fig. 1(g)). As evident, annealing leads to grain growth and a significant reduction in the number of nano-sized grains (Fig. 1(h)). This can be attributed to the growth process where small grains merge to form larger ones. In the temper-rolled sample, the unrolled grains keep their size and shape from annealing. The rolled parts lose their grain structure but exhibit non-uniform surfaces due to roll-induced roughness and voids, such as cracks resulting from grain breakage during rolling (Fig. 1(i)).
Fig. 2 (a-f) shows the results of the EBSD analysis of all three samples. Analysis of the surface texture (Fig. 2 (a-c)) shows that, despite the increase in grain size after annealing, no preferred orientation is evident on the surfaces of any of the samples. Table 2 presents the texture orientations identified on the surfaces, indicating the percentage of each crystallographic plane, including (100), (110), (220), and (111), present on the surfaces. The percentage of the (100) plane decreases from 23.5 % in the electroplated sample to 16 % in the annealed sample, while it remains close to the 21 % observed in the temper-rolled sample. Conversely, the percentage of the (111) plane increases as the sample progresses from electroplated to temper-rolled, following the order: Electroplated < Annealed < Temper-rolled. Both the (110) and (220) planes belong to the same family, with the (220) planes being a higher-order reflection of the (110) planes. Thus, it can be stated that the combined percentage of both planes is highest for the annealed sample and remains within the same range for the electroplated and temper-rolled samples. The annealing process enhances the presence of (110) and (220) planes, whereas the temper-rolling process increases the proportion of (111) and (100) planes.
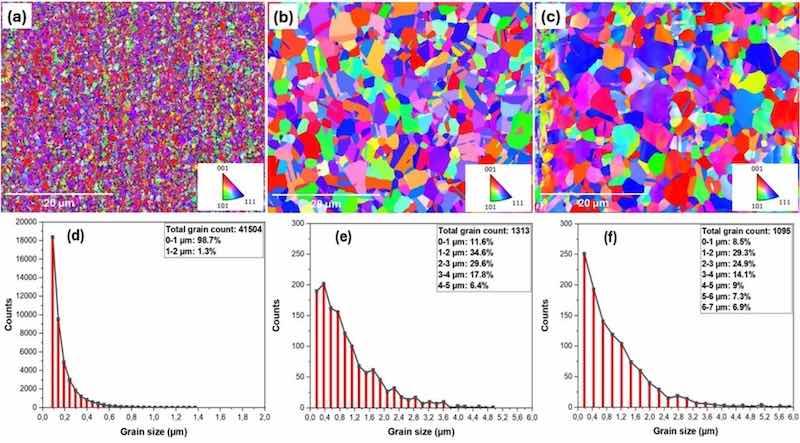
Fig. 2. EBSD analysis from surface textures of (a) electroplated, (b) annealed, (c) temper-rolled samples, and grain size distributions of (d) electroplated, (e) annealed, (f) temper-rolled samples.
Table 2. Surface texture orientation for different processes.
| Texture orientation | Electroplated | Annealed | Temper-rolled |
| (100) | 23.5 % | 16.0 % | 20.7 % |
| (111) | 16.0 % | 18.4 % | 25.1 % |
| (110) | 14.0 % | 22.0 % | 16.1 % |
| (220) | 23.0 % | 24.6 % | 18.0 % |
The EBSD assessment of grain size changes revealed that the electroplated surface has a nano/submicron grain structure (Fig. 2(d)) in a way that about 99 % of the grains are below 1 µm. The total number of grains counted is 41504, from which around 18,500 are below 100 nm. After annealing and temper-rolling, the number and distribution of grains change significantly. Specifically, the grain count decreases to 1313 in the annealed samples and 1095 in the temper-rolled samples, a substantial reduction compared to the electroplated sample. The grain sizes range from submicron (0.178 µm) to a maximum of 5 µm, with the majority falling between 1 and 4 µm in the annealed samples (Fig. 2(e)) and between 1 and 6 µm in the temper-rolled samples (Fig. 2(f)).
This is also evident in the grain boundary maps in Supplementary Section (Fig. S1(a–c)), which show the locations and sizes of low-angle grain boundaries (LAGB, with misorientations of 5-15°), high-angle grain boundaries (HAGB, with misorientations of 15–57.5°), and coincident site lattice boundaries (CSL, with misorientations greater than 57.5°). CSL refers to the Σ (Sigma) coincidence site lattice, where Σ represents the reciprocal density of coinciding atomic sites. The results indicate that when the electroplated sample undergoes annealing, the percentage of LAGB and HAGB boundaries decreases, while the CSL boundaries increase by up to 6.5 % (Table 3). In contrast, both HAGB and LAGB boundaries increase for the temper-rolled sample, and the CSL boundaries decrease by 13.6 % compared to the annealed sample (Table 3). As reported in Table 4, the number of twinned grains is significantly higher in the electroplated samples compared to the annealed and temper-rolled samples. However, the area fraction of twinned grains is higher in the annealed samples than in the electroplated and temper-rolled samples, which have similar area fractions.
Table 3. Grain boundary distribution of different samples.
| Grain boundary type | Electroplated | Annealed | Temper-rolled |
| LAGB (%) | 4.07 | 1.73 | 7.59 |
| HAGB (%) | 55.2 | 51.2 | 58.8 |
| CSL (%) | 40.7 | 47.1 | 33.6 |
Table 4. Surface twinned grains count and area fraction after different processes.
| Twin grain characteristics | Electroplated | Annealed | Temper-rolled |
| Twinned Grains Count | 14;625 | 350 | 256 |
| Twinned Grain Area Fraction | 85.98 | 93.47 | 86.54 |
The relationship between grain boundary proportion and corrosion resistance can be explained by grain boundary energy theory and the nature of different boundary types. Grain boundaries have lower atom coordination and higher electron activity, leading to easier electron transfer and species adsorption. This increased reactivity, along with more nucleation sites, can cause an increase in the rates of charge transfer [57].
For nickel, it is known that the amount of Σ3-bounderies shows a direct correlation with the corrosion resistance. Grain boundaries with low Σ values have ordered structures and lower energy, making them more stable. In contrast, high-angle random boundaries are disordered and have higher energy. Low-energy boundaries tend to be more resistant to grain boundary-related phenomena, while high-energy boundaries are more active and susceptible due to their structure-dependent properties [58].
In the electroplated samples, twinning primarily consists of nanotwins, whereas in the annealed and temper-rolled specimens, the twinned grains transition to submicron and micron sizes. It has been reported that nanotwins can form a cohesive passive film and enhance corrosion resistance when their density is higher than that of submicron/micron-scale twins [23,59,60]. Annealing twins quickly form during heat treatment due to their significantly lower boundary energy compared to random high-angle boundaries. The likelihood of twin formation increases with smaller initial grain sizes, making this process an effective mechanism for reducing overall grain boundary energy during grain growth [44,47].
The results (Table 4 and Fig. S1(a–c)) suggest that, although annealing twins are fewer in number compared to those in the electroplated sample, their size has increased, resulting in a larger surface area occupation. In the case of temper-rolling, the process appears to alter the grain boundary arrangement, resulting in an increase in LAGB (Σ1) and a decrease in the percentage of CSL (Σ3) boundaries. These changes may be linked to variations in roll roughness and fluctuations in the size and position of grains, as observed in the surface analysis (Fig. 1(c)), which lead to inconsistent contact between the roll and the surface. Nevertheless, this overall increase in grain size results in a reduction of the grain boundary network, which, based on previous research, lowers the grain boundary energy [61] and is beneficial to the formation of dense and smooth passive film [60].
3.2. Chemical composition distribution through the coating thickness
Fig. 3 (a-c) shows SEM micrographs of the cross-sections of the electroplated, annealed, and temper-rolled samples after etching. The etching of the electroplated sample revealed its typical columnar structure, which is characteristic of nickel electroplated coatings. After annealing, the structure changes as an intermediate layer is formed at the interface between the steel substrate and the Ni coating. This layer forms as a result of Fe diffusion from the substrate into the Ni coating during annealing, leading to the formation of a FeNi layer. This effect is most pronounced in the temper-rolled sample, where the FeNi layer appears along the steel-Ni interface (Fig. 3(c)). This layer, approximately one micrometre thick, conforms to the substrate's roughness. The temper-rolled sample’s outer surface is notably more uniform than the others because of the rolling process, which enhances surface flatness.
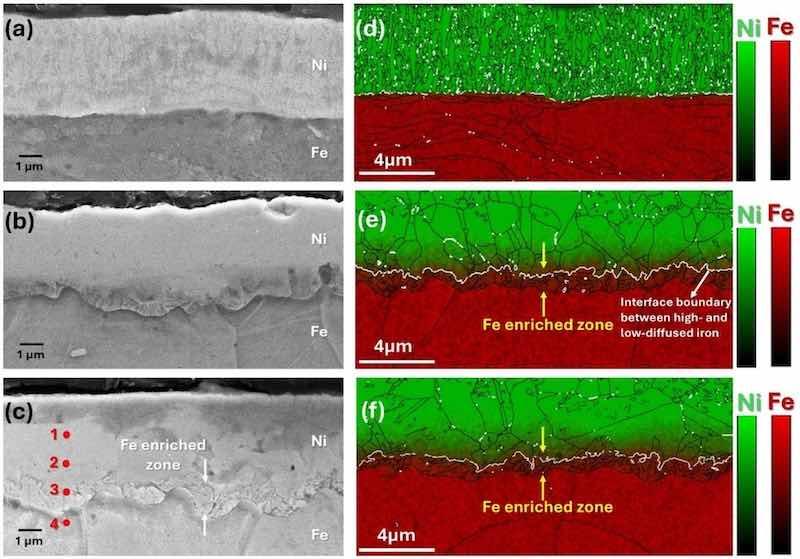
Fig. 3. SEM image from the etched cross-section of (a) electroplated, (b) annealed, (c) temper-rolled samples, EBSD cross-sectional analysis merged with EDS elemental map distribution of (d) electroplated, (e) annealed, (f) temper-rolled samples.
Fig. 3(d–f) presents the EBSD cross-sectional analysis merged with the EDS elemental map distribution of different samples. A distinct interface is observed between the Ni electroplated coating and the steel substrate, with no detectable diffusion (Fig. 3(d)). However, in the annealed and temper-rolled samples (Fig. 3(e, f)), a diffusion gradient of Fe towards the Ni coating is evident, as also observed in Fig. 3(b, c). Furthermore, EBSD analysis reveals a white line, signifying the interface boundary between regions of high and low iron diffusion (indicated by the white arrows).
The diffusion of Fe into the Ni coating is confirmed by EDS measurements taken from different points in the cross-section (Fig. 4). The results indicate that as the analysis progresses from the outer layer of the coating towards the substrate (points 1 to 3), the Ni concentration decreases while the Fe concentration increases. At point 3, the Fe concentration peaks at approximately 71 at%, whereas at point 4, located on the steel substrate, only Fe is detected, with trace amounts of Ni below 1 at%, likely due to signal overlap from the electron beam. No nickel diffusion into the steel substrate is observed.
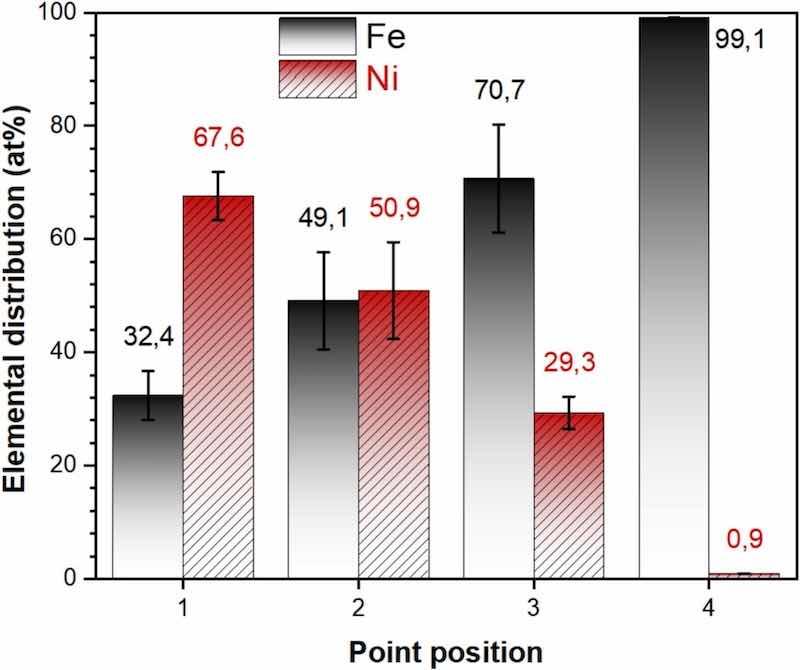
Fig. 4. Elemental distribution corresponding to the selected points of EDS analysis in Fig. 3c.
GDOES analysis (Fig. 5) was performed to obtain a quantitative analysis of element distribution across the coating thickness. The results of the electroplated sample show no Fe-Ni diffusion; instead, a sharp Ni drop at the interface (Fig. 5(a)), likely due to substrate roughness affecting the final micrometer of the coating. In contrast, the annealed and temper-rolled samples, Fig. 5 (b, c), exhibit a distinct pattern: the initial micrometer of the coating primarily consists of pure Ni, followed by a gradual decrease in Ni content as the amount of Fe in the coating increases toward the steel substrate. This increase is such that at 3 µm, the concentration of Fe and Ni becomes equal (50 wt%), and by 4 µm, the Fe concentration rises to approximately 90 wt%, forming the FeNi layer illustrated in Fig. 3(c). Apart from Fe and Ni, traces of carbon are also found in the samples. In the electroplated sample (Fig. 5(a)), the carbon concentration in the steel substrate is approximately 0.03–0.04 wt%, aligning with the low carbon steel range reported in Table 1. Following annealing, the carbon concentration increases to a range of 0.1 to 0.2 wt%, predominantly accumulating at the interface between the steel and coating (Fig. 5(b, c)). In both the Ni coating and the steel substrate, carbon is notably present near this interface (from 3.5 to 4.5 µm). EPMA cross-sectional images of the temper-rolled sample in Supplementary Section (Fig. S2 (a–c)) further support the GDOES findings on the diffusion gradient and carbon presence. The increase in carbon concentration is attributed to annealing at 500–1000 °C, which recrystallizes the cold-rolled steel and allows carbon to migrate and accumulate at the steel/Ni coating interface [62].
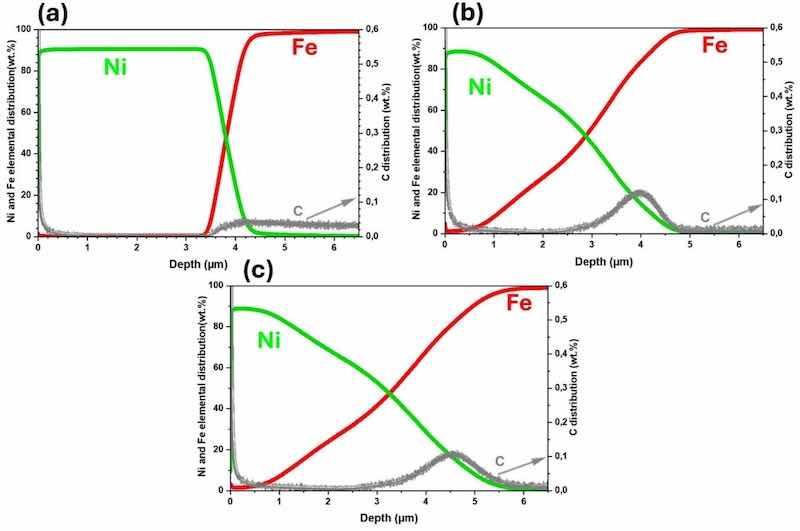
Fig. 5. GDOES profiles from (a) electroplated, (b) annealed, and (c) temper-rolled samples.
3.3. Electronic surface potential distribution through the coating thickness
Cross-sectional SKPFM maps of the Ni-coated film/steel system were conducted to better visualize the impact of both thermal annealing and mechanical (temper-roll) treatments on the electronic properties of the Ni-electroplated coating. This analysis of the Ni/steel interface reveals the morphology and surface potential variations resulting from the distribution of the chemical composition across the cross-section. It provides insight into the intrinsic nobility of individual regions or layers based on their work function [63,64]. Fig. 6 presents the cross-sectional AFM topography and corresponding SKPFM surface potential maps of all electroplated, annealed, and temper-rolled samples. The line profiles are also considered to measure the potential variations in different regions of the samples. The topographical maps in Fig. 6 (a, d, g) display the polished surface of the samples. The coating and steel interface are not visible except in the tamper-rolled sample (Fig. 6(g)), where they are slightly discernible. However, the corresponding surface potential signal reveals two distinct regions in the electroplated sample: Ni and steel (Fig. 6(b)). In contrast, the annealed (Fig. 6 (e)) and temper-rolled (Fig. 6 (h)) samples exhibit four distinguished regions, including Ni, diffused region II, diffused region I, and steel (Fe is in balance). Diffused regions I and II refer to areas with different Fe distributions: Region I is highly enriched with iron near the steel-Ni coating interface, while Region II has lower Fe diffusion. In a basic Ni/steel (Fe) system or electroplated sample, the Ni region exhibits a higher surface potential than the steel substrate, and the difference is about 58 mV (Fig. 6 (c)). However, in annealed and temper-rolled samples, the distribution of surface potential changes, following the order: Ni > diffused region II > steel > diffused region I. This is indicated in line profiles, Fig. 6 (f, i), where a reduction in potential can be recognized for the diffused region I compared to the steel potential (about 20 to 40 mV for the annealed and 20–25 mV for the temper-rolled samples). The annealing and temper-rolling processes alter the potentials of the steel substrate and nickel coating. This is likely due to the microstructural evolution of cold-rolled steel to recrystallized grains and Ni grain growth resulting from annealing. This is according to the observations by other researchers who show thermo-mechanical processes that cause microstructural changes in surface potential distribution [65,66]. The other point is that annealing and the subsequent temper-rolling lead to an increase in the potential difference between the Ni coating and the steel. This increase is approximately 70 mV and 85 mV for annealing and temper rolling, respectively. This confirms the increase in Ni nobility compared to the steel substrate, resulting from the aforementioned operations.
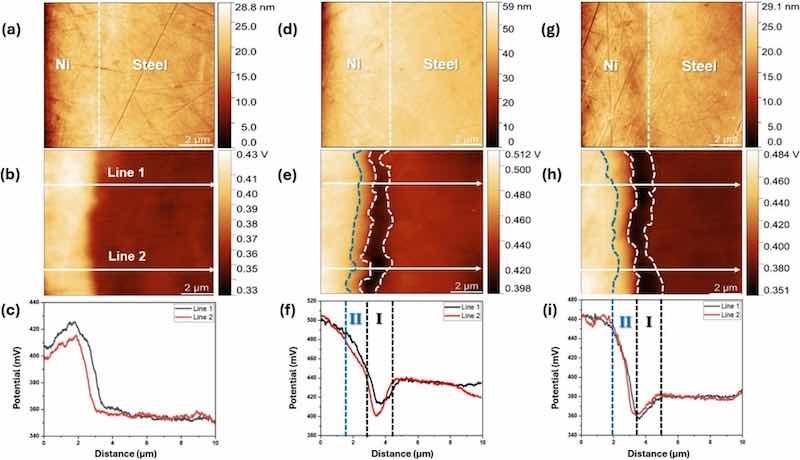
Fig. 6. The cross-sectional AFM topography and SKPFM potential maps topography, and line profile of all (a, b, c) electroplated, (d, e, f) annealed, and (g, h, i) temper-rolled samples.
The electrical surface potential of a conductive sample is influenced by differences in work function (WF) between the sample and the AFM tip [67,68]. Chemical and physical alterations of metallic surfaces due to environmental exposure, such as oxidation, changes in roughness and morphology, can substantially influence the work function and local surface potential [69]. In diffused regions I and II, the varying surface potential compared to steel reflects changes in local work function caused by Fe distribution. The surface potential variations in regions I and II, as measured by SKPFM, align with SEM/EDS and GDOES results, which show Fe concentration decreasing from 70 wt% in region I (point 3 of Fig. 4) to about 50 wt% in region II (point 2 of Fig. 4). EPMA and GDOES also reveal a heterogeneous carbon signal in region I, near the steel interface, due to residual carbon during Fe diffusion. This accounts for the lowest surface potential observed in Region I, which is primarily attributed to carbon presence and heterogeneities induced by the alloying of the less noble element (Fe). This alloying process reduces the overall work function by altering the electronic structure and surface composition [70]. This region, therefore, has the highest energy and lowest nobility. As Fe diffuses into the Ni coating, diffused region II shows a lower surface potential than Ni (Fig. 6(f, i)). Surface potential line profiles (Fig. 6(f, i)) demonstrate that temper-rolling, compared to annealing, results in a more uniform surface potential distribution across regions I, II, and the Ni coating.
3.4. Surface oxide analysis using XPS
X-ray Photoelectron Spectroscopy (XPS) was employed to analyze the composition of passive layers. Electroplated, annealed, and temper-rolled samples were immersed in a 0.1 M NaCl solution for 30 min before XPS analysis. This immersion time and solution were consistent with the pre-conditioning used in electrochemical tests. Fig. 7(a, c, e) presents the high-resolution XPS spectra of Ni 2p, showing the chemical states for each sample. Notably, the high-resolution spectra of Fe were also evaluated, but no trace of Fe was detected. The Ni 2p3/2 spectra for all samples reveal three peaks at 852.65 eV, 854.30 eV, and 856.74 eV, corresponding to Ni, NiO, and Ni(OH)2, respectively. The position and shape of the Ni 2p spectral feature are consistent with the data reported in the literature [71,72]. In the O 1 s spectra (Fig. 7(b, d, e)), peaks at 529.37 eV, 532.17 eV, and 535.07 eV correspond to O2-, OH-, and H2O, respectively. The temper-rolled sample shows a larger O2- peak area, indicating increased NiO formation compared to electroplated and annealed samples.
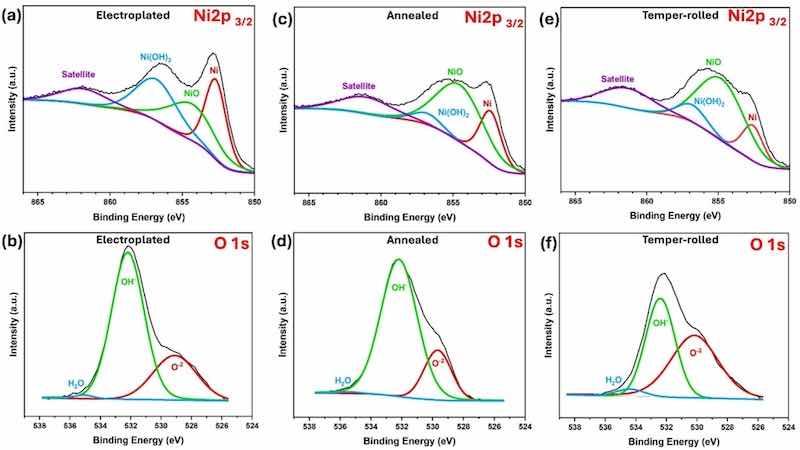
Fig. 7. High-resolution XPS spectra of Ni 2p and O 1 s for (a,b) electroplated, (c,d) annealed, (e,f) temper-rolled after 30 min of immersion in 0.1 M NaCl solution.
XPS evaluations confirm that the passive film consists of NiO and Ni(OH)2. However, the proportion of oxide and hydroxide varies with the treatment applied to the samples. Prior studies indicated that Ni(OH)2 forms the outer layer, while NiO forms the inner layer in contact with the Ni coating [73,74]. The Ni 2p3/2 spectra (Fig. 7(a, c, e)) reveal a trend: moving from the electroplated to the annealed and temper-rolled samples, the metallic Ni peak area decreases while the NiO peak area increases. Area ratios derived from high-resolution XPS data (Fig. 8) provide further insights. In the electroplated sample, the area ratios of Ni, NiO, and Ni(OH)2 are approximately equal at 33 % each. However, Ni content decreases in the annealed and temper-rolled samples while nickel oxide increases significantly. The nickel oxide content in the temper-rolled sample reaches 68.5 %, compared to 65 % in the annealed sample. A similar pattern is observed with nickel hydroxide, where the temper-rolled sample contains 12.5 % versus 8 % in the annealed sample. These area ratios indicate that the share of NiO increases after annealing and temper-rolling compared to the electroplated sample.
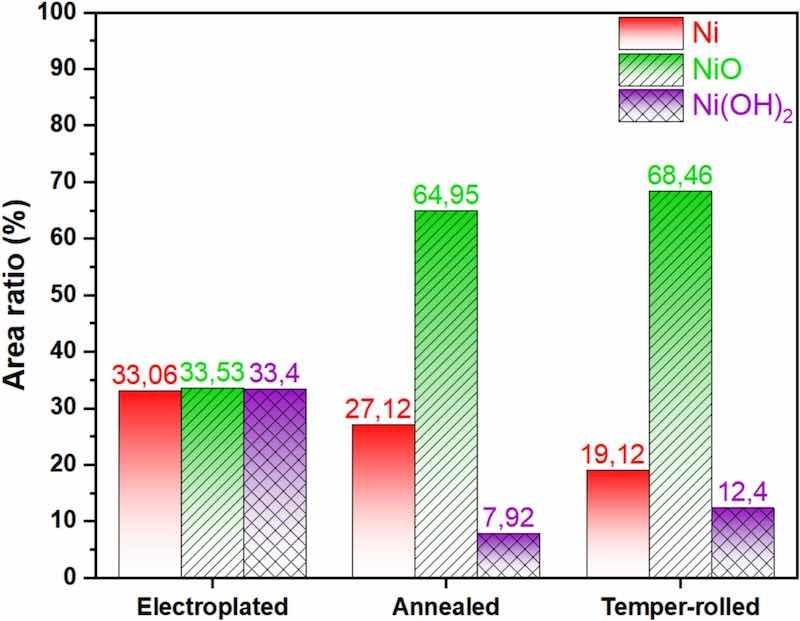
Fig. 8. Comparison among the area ratios derived from high-resolution XPS data for different samples.
Although NiO is the dominant phase contributing to the corrosion resistance of passive films on nickel, Ni(OH)2 also plays a crucial and complementary role. NiO forms the inner, more compact barrier layer directly in contact with the metal substrate. In contrast, Ni(OH)2 typically forms the outer layer through a dissolution–precipitation process at lower anodic potentials. This outer hydroxide layer acts as an initial barrier, slowing ionic exchange and mitigating environmental attack [75,76]. Surface-enhanced Raman spectroscopy has confirmed that Ni(OH)2 forms before NiO and persists even at more anodic potentials, indicating its chemical stability across a wide electrochemical range [76]. However, Ni(OH)2 is usually poorly crystalline and hydrated, which contributes to its high porosity. Despite this, the hydroxide layer enhances the passivation mechanism by adsorbing water and hydroxide ions, potentially improving the film’s self-healing capability [77,78].
In the current study, XPS data show that the Ni(OH)2 content decreases from the electroplated to the annealed samples, suggesting that annealing promotes NiO formation while reducing Ni(OH)2. In contrast, the Ni(OH)2 content increases to 12.5 % in the temper-rolled samples, which correlates with improved corrosion resistance. Therefore, while NiO serves as the principal protective phase, Ni(OH)2 contributes to enhancing the overall integrity and stability of the passive film, particularly under localized corrosion conditions.
3.5. Corrosion behavior assessment of the of nickel coating
As illustrated in Fig. 9(a), the OCP potentials for annealed and temper-rolled samples are more positive than the electroplated ones, which shows that the electroplated samples are less noble compared to the others. Although the OCP of the temper-rolled sample is more positive than that of the annealed sample, their potential can be pretty close. As can be seen, the potential quickly reaches stability for the temper-rolled and annealed samples. In contrast, the potential of the electroplated sample continues to change and has not yet stabilized.
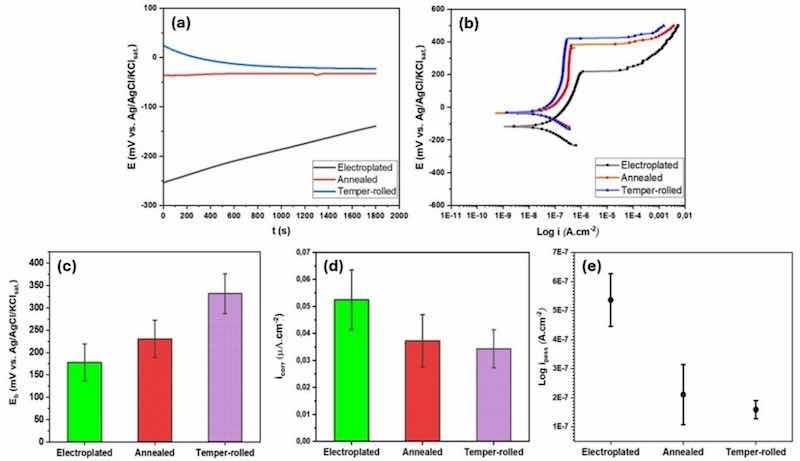
Fig. 9. Comparison among (a) OCP, (b) polarization curves, (c) breakdown potentials, (d) corrosion current densities, and (e) passivity current densities of different samples after 30 min immersion in 0.1 M NaCl solution and pH 6.
A similar trend is evident in the potentiodynamic polarization curves (Fig. 9(b)), where the corrosion potential of the electroplated sample is more negative (approximately −150 mV vs. Ag/AgCl/KClsat.) compared to the annealed and temper-rolled samples, which are around −50 mV. The potentiodynamic polarization measurements revealed a passive region and breakdown potential for all samples, indicating susceptibility to localized corrosion. The values of Ecorr, Eb, icorr, and ipass extracted from the curves are presented in Table 5. Fig. 9(c) illustrates an increasing trend in the breakdown potential (Eb) from electroplated samples to temper-rolled samples, with the electroplated samples having the lowest Eb values and the temper-rolled samples having the highest. As shown in Fig. 9(d, e), the electroplated samples exhibit a shift towards higher current densities for both corrosion current and passive current densities compared to the annealed and temper-rolled polarization curves. The results show that the electroplated samples require higher current densities to achieve passivity, indicating that the annealed and temper-rolled samples have better passivation capabilities.
Table 5. Values of Eb, Ecorr, icorr, and ipass extracted from the potentiodynamic polarization curves of electroplated, annealed, and temper-rolled samples.
| Specimen | Eb (mV) | Ecorr (mV) | icorr (µA.cm−2) | ipass (A.cm−2) |
| Electroplated | 178 ± 41 | −101.6 ± 11 | 0.05 ± 0.01 | 5.4 × 10⁻⁷ |
| Annealed | 230 ± 42 | –33.7 ± 27 | 0.04 ± 0.01 | 2.1 × 10⁻⁷ |
| Temper-rolled | 332 ± 44 | –32.2 ± 16 | 0.03 ± 0.01 | 1.6 × 10⁻⁸ |
After the potentiodynamic test, the evaluation of the exposed surfaces revealed variations in the number of localized corrosion sites present on the surfaces of the three sample types. Fig. 10(a–c) depicts representative stereographic images from the surfaces of the electroplated, annealed, and temper-rolled after the test. As observed, a dark area formed around each pit, indicating the accumulation of corrosion products arranged in the direction of gravity, as the specimens were positioned vertically in the test medium. Visual examination revealed pitting as the type of localized corrosion, with the number of corrosion sites being 53 ± 14, 21 ± 6, and 12 ± 6 for electroplated, annealed, and temper-rolled samples, respectively. The microstructure of the electroplated samples, which comprise nickel nano/submicron grains, seems more prone to localized corrosion.
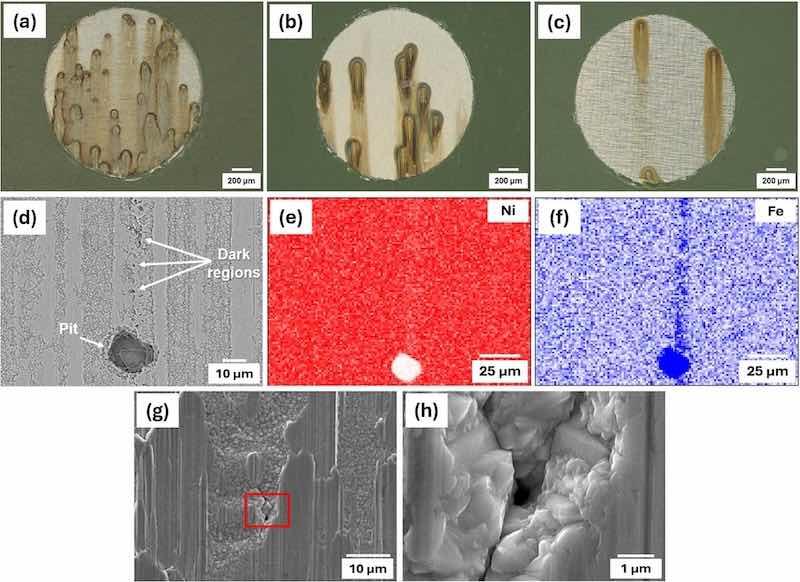
Fig. 10. Examples of stereographic images from the surfaces of the (a) electroplated, (b) annealed, and (c) temper-rolled after potentiodynamic test (after 30 min immersion in 0.1 M NaCl solution), (d) backscattered image of a temper-rolled sample surface along with EDS of (e) Ni map, (f) Fe map after the test, (g) corrosion initiation site on the surface of temper-rolled samples, and (h) the same image with higher magnification.
Fig. 10(d) shows a backscattered image of a temper-rolled sample surface after the potentiodynamic test. The squeezed and granular areas are easily distinguishable. However, due to the large pit size, it's difficult to determine if the initiation sites are in the granular or squeezed areas. Some dark points or regions along the pit, highlighted in Fig. 10(d), indicate tiny grain parts situated between squeezed areas. Elemental maps in Fig. 10(e) and (f) reveal Fe in these dark areas, confirming preferential corrosion sites.
To further investigate vulnerable sites, several temper-rolled samples underwent potentiodynamic polarization measurements, which were stopped just before a sharp increase in current density and pit growth (≈ 400 mV). Fig. 10(g) shows a corrosion initiation site in the granular area of the specimen. The magnified image in Fig. 10(h) reveals a pore-shaped defect on the surface that, under polarization, extends deeper and propagates like a crack among surrounding grains. These findings suggest that granular sites are likely preferential sites for corrosion onset.
Fig. 11(a–c) shows the EIS results for the three sample types, measured separately from potentiodynamic polarization test after 30 min of immersion in 0.1 M NaCl. EIS assesses the Ni coating’s barrier properties and corrosion resistance, complementing potentiodynamic polarization results in evaluating electrochemical behavior. The Nyquist plots in Fig. 11(a), show different semicircle diameters following the order: Electroplated < Annealed < Temper-rolled, indicating that temper-rolled samples have the highest charge transfer resistance (polarization resistance) and superior corrosion resistance. Fig. 11(b) and (c) compare the Bode phase and amplitude diagrams for each sample. The amplitude graphs reveal that capacitance onset occurs at higher frequencies for the annealed and temper-rolled samples than for the electroplated sample. The phase angle diagrams also show a broader bell curve for the annealed and temper-rolled samples, indicating enhanced charge transfer resistance. This is consistent with the XPS results, which show an increased area ratio of NiO in annealed and temper-rolled samples. Fig. 11(d) reports the average polarization resistance values at 0.01 Hz from the amplitude diagrams for electroplated, annealed, and temper-rolled samples, confirming the superior performance of the annealed and temper-rolled samples.
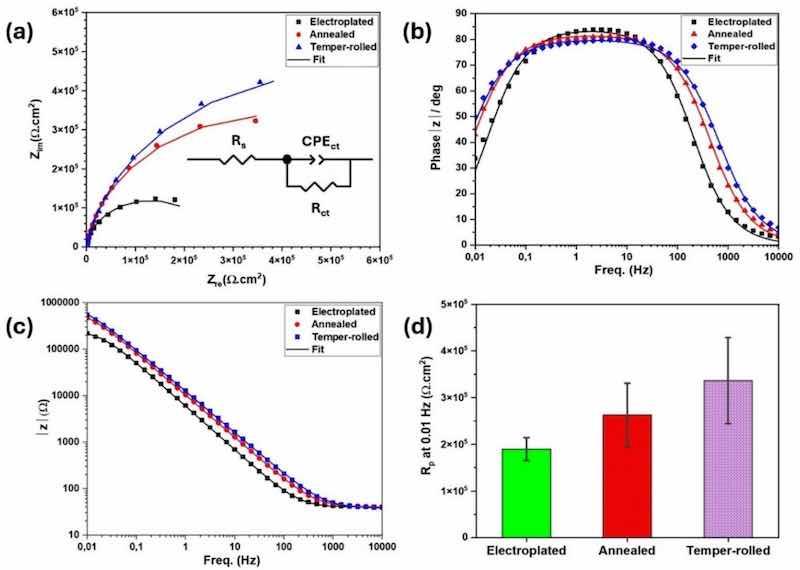
Fig. 11. The fitted results of EIS for the three sample types, (a) Nyquist and equivalent circuit, (b) bode phase, (c) bode amplitude (after 30 min immersion in 0.1 M NaCl solution), and (d) comparison among Rp (at 0.01 Hz) of electroplated, annealed, and temper-rolled samples.
An equivalent electrical circuit can aid in analyzing the characteristics of the passive layer based on its capacitive and resistive behavior [79,80]. Various parameters, such as film capacitance, charge transfer resistance, and solution resistance, can be derived from a fitted circuit. Due to the presence of heterogeneities, the capacitance is an imperfect capacitor and is modelled as a constant phase element (CPE). The equivalent circuit model consists of Rs, Rct, and CPEct, which represent the solution resistance, charge transfer resistance at the Ni metal/oxide interface, and a constant phase element of the Ni metal/oxide interface, respectively. The electrical impedance of a CPE can be calculated according to Eq. (1) [81,82].
ZCPE = 1/[Q(ωi)n (1)
where (Q) is a constant with the units of F cm−2 s(n−1), (ω) is the angular frequency, (i) is the imaginary component, and (n) is the exponent of Q that is between −1 1 where −1 is pure inductance, 0 is pure resistance, and 1 is pure capacitance. Table 6 presents the fitted parameters extracted from the equivalent circuit of Fig. 11(a).
Table 6. Fitted parameters extracted from the equivalent circuit for three sample types.
| Specimen | Rs (Ω.cm2) | CPENi/oxide interface (µF cm−2 s(n−1)) | n1 | RNi/oxide interface (kΩ.cm2) | Chi-squared |
| Electroplated | 40.1 ± 0.4 | 29.8 ± 0.4 | 0.94 ± 0.003 | 261.5 ± 10 | 0.001 |
| Annealed | 40.02 ± 0.4 | 18.1 ± 0.2 | 0.91 ± 0.002 | 772.9 ± 24 | 0.0008 |
| Temper-rolled | 37.89 ± 0.4 | 15.5 ± 0.2 | 0.89 ± 0.002 | 1053.1 ± 58 | 0.002 |
In the selected circuit, the time constant reflects the physicochemical interaction between the Ni metal/oxide and the electrolyte, where charge transfer resistance originates from both the Ni metal and oxide layers. This resistance is approximately 261, 773, and 1053 kΩ·cm2 for electroplated, annealed, and temper-rolled samples, respectively (electroplated < annealed < temper-rolled). Variations in charge transfer at the interface are closely linked to the properties of surface passive films [83]. Furthermore, the CPEct values of the three sample types decrease as one moves from electroplated to temper-rolled samples. Generally, the capacitive behavior may be linked to the double layer at the oxide film/metal surface [84], where a lower CPE value indicates a smoother and more protective passive film on the surface of the samples [85]. This aligns with the XPS results in Fig. 8, where the area ratio of oxide film increases from electroplated to annealed, and then to temper-rolled coatings. This shift reduces CPEct and increases Rct (Table 6).
3.6. Corrosion mechanism of different treated nickel coatings
The surface evaluation revealed changes in the morphology of Ni-electroplated steel after annealing and temper-rolling. Surface features such as texture, grain size, and grain boundaries can influence the coating's final performance by altering the microstructure during processing [[86], [87], [88]]. Grain boundaries have a significant impact on material properties, including corrosion resistance, creep, solute segregation, and deformation behavior. Many studies on the grain boundaries of materials attribute improvements in the aforementioned properties to a higher proportion of low-Σ coincidence site lattice (CSL) boundaries [[89], [90], [91], [92], [93], [94]]. The material's processing history, including heat treatment and deformation, can impact the occurrence of these sites [94]. Among these Σ boundaries, low-angle (Σ1) boundaries and Σ3 coincidence boundaries have much lower relative boundary energies compared to random general boundaries [58]. Σ3 boundaries are associated with twinning, and their quantity is directly linked to improved corrosion resistance [87,95]. It is well known that FCC metals like nickel, which have low stacking fault energies, tend to develop a high density of twins during fabrication processes and subsequent annealing [61,87]. It is important to note that nearly all of the CSL boundaries measured in this research were Σ3 boundaries, so the percentage of CSL can effectively be considered as the percentage of Σ3 boundaries. This caused the twinned grains to occupy a larger surface area, resulting in a more stable passive layer. Surface and cross-sectional evaluations of annealed and temper-rolled samples revealed that the outer 1 µm of the Ni coating is free of Fe or its oxides, remaining pure. This indicates that the outer part of the coating, in contact with the corrosive solution, retains a higher work function (nobility) compared to the inner regions. Fe diffusion lowers the work function in the inner regions, making them more susceptible to corrosion. These areas promote pit propagation after passivity breakdown and facilitate pit initiation.
Nanograins and twins indeed improve the passive layer quality of the electroplated sample. Still, at the same time, the passive layer is weak and full of high-energy areas (grain boundaries) that can facilitate the diffusion of aggressive ions (i.e., chloride) to the surface of the Ni coating. This is due to numerous grain boundaries formed during the nucleation and growth of a crystalline passive film, which can serve as preferential nanostructural defects, leading to passivity breakdown and the initiation of localized corrosion [96]. In the annealed sample, the passive layer integrity significantly improved due to the less defective nickel coating and the increased area fraction of submicron twinned grains (low-energy grains), which resulted in a higher NiO content and enhanced charge transfer resistance (Rct). In the temper-rolled samples, both Ni(OH)2 and NiO levels are higher compared to the annealed sample, resulting in a greater proportion of oxide/hydroxide in the passive layer. Under these conditions, the charge transfer resistance at the oxide/Ni coating interface is significantly high, indicating superior performance and quality of NiO compared to the annealed and electroplated samples. This improvement can be attributed to the combined effect of the high-density submicron twins and low-energy planes, such as (111) and (100), in the surface microstructure of the temper-rolled sample, which collectively enhances the protective performance of the passive layer. The (111) planes typically exhibit lower surface energy than other planes, such as (110), making them more stable and less reactive. This reduced reactivity decreases the likelihood of rapid oxidation [46]. The stability of the (111) planes is linked to their atomic arrangement, with packing density following the order: (111) > (100) > (110). In other words, higher packing density corresponds to lower surface energy [97,98]. This means that the surface structure of the metallic coating plays a crucial role in determining the performance of the passive film [99]. Fig. 12 presents a schematic overview of the passivity and corrosion performance for the three types of samples analyzed in this study. The surface microstructure determines the characteristics of the passive layer. In contrast, the cross-sectional microstructure influences the progression of dissolution after the breakdown of the passive film and the growth of pitting. Localized corrosion preferentially initiates in granular areas where pores are more likely to exist. Typically, these pores form during the electroplating process [100]. Annealing helps eliminate pores and defects, reducing vulnerable sites for localized corrosion. The microstructure is further refined by temper rolling, which compresses Ni grains and decreases the specific surface area exposed to the environment.
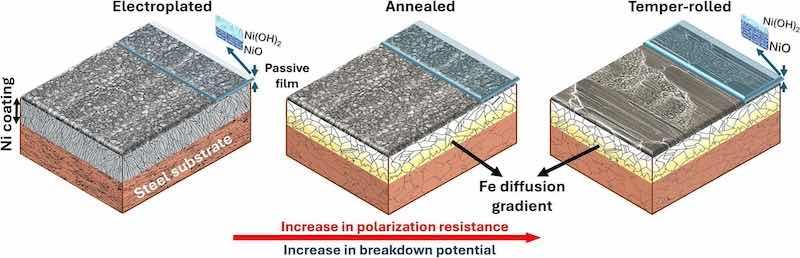
Fig. 12. Schematic overview of the surface morphology, microstructure, passivity, and corrosion performance for all types of samples.
4. Conclusions
The microstructural features and corrosion behavior of the nickel coating at three consecutive stages of the process, from electroplating to temper-rolling, are systematically evaluated. To achieve this, a variety of characterization techniques were employed, including SEM/EDS, EBSD, EPMA, GDOES, AFM/SKPFM, and XPS analysis. For corrosion evaluations, potentiodynamic polarization and EIS tests were performed during a 30-minute immersion in a 0.1 M NaCl solution. The key findings are summarized as follows:
- Annealing and temper-rolling processes coarsened the nano/submicron microstructure of electroplated samples into a submicron/micron structure. While fewer twinned grains were observed, they grew larger, covering more surface area.
- Annealing induces iron diffusion from the substrate into the Ni coating, forming an iron-rich zone near the steel substrate while leaving only the outermost ∼1 µm layer as pure nickel.
- The cross-sectional surface potential analysis revealed distinct regions in the treated coated samples, including a Ni-rich region, diffused region II, and a diffused region I (iron-rich), as well as steel in both annealed and temper-rolled samples. In annealed and temper-rolled samples, the order of the surface potential was Ni > diffused region II > steel > diffused region I. Fe diffusion into the coating reduced the nickel surface potential in FeNi zones (I and II), diminishing their intrinsic nobility. Zone I, with heterogeneities near the interface and carbon presence, exhibited the lowest surface potential.
- Potentiodynamic polarization and EIS analyses confirmed that annealing and temper-rolling processes enhance resistance to localized corrosion. The corrosion observed occurs as pitting, initiated at granular areas where the presence of pores provides pathways for the solution to reach the steel substrate.
- All samples formed a passive film consisting of NiO and Ni(OH)2. In annealed and temper-rolled samples, increased NiO content and fewer coating defects enhanced passive layer resistance, which was further strengthened in temper-rolled samples by low-energy planes.
Written by Arash Azimi Dastgerdia, Ehsan Rahimia, Maxim Aarntsb, Prasad Gonuguntaa, Prasaanth Ravi Anusuyadevia, Ricardo Bouwerb, and Yaiza Gonzalez-Garciaa
- Delft University of Technology, Department of Materials Science and Engineering, Mekelweg 2, 2628 CD Delft, the Netherlands
- TATA Steel, Research & Development, Ijmuiden Technology Centre, 1970 CA Ijmuiden, the Netherlands
CRediT authorship contribution statement: Arash Azimi Dastgerdi: Writing – review & editing, Writing – original draft, Visualization, Validation, Methodology, Investigation, Formal analysis, Data curation, Conceptualization. Ehsan Rahimi: Writing – review & editing, Methodology, Investigation, Formal analysis, Data curation. Maxim Aarnts: Investigation, Formal analysis. Prasad Gonugunta: Data curation. Prasaanth Ravi Anusuyadevi: Data curation. Ricardo Bouwer: Visualization, Validation, Resources. Yaiza Gonzalez-Garcia: Writing – review & editing, Visualization, Validation, Supervision, Project administration, Funding acquisition, Conceptualization.
Declaration of competing interest: The authors declare that they have no known competing financial interests or personal relationships that could have appeared to influence the work reported in this paper.
Acknowledgments: This research was carried out under Project no. T21011 in the framework of the Research Program of the Materials Innovation Institute (M2i) (www.m2i.nl) supported by the Dutch Government.
References
[1] F. Presuel-Moreno, M.A. Jakab, N. Tailleart, M. Goldman, J.R. Scully Corrosion-resistant metallic coatings Mater. Today, 11 (2008), pp. 14-23, 10.1016/S1369-7021(08)70203-7
[2] S.R. Taylor, Coatings for Corrosion Protection: An Overview, in: Encycl. Mater. Sci. Technol., Elsevier, 2001: pp. 1259–1263. DOI: 10.1016/B0-08-043152-6/00237-0.
[3] R. Selvaraj, M. Selvaraj, S.V.K. Iyer Studies on the evaluation of the performance of organic coatings used for the prevention of corrosion of steel rebars in concrete structures Prog. Org. Coat., 64 (2009), pp. 454-459, 10.1016/j.porgcoat.2008.08.005
[4] L. Elias, A. Chitharanjan Hegde Electrodeposition of laminar coatings of Ni–W alloy and their corrosion behaviour Surf. Coat. Technol., 283 (2015), pp. 61-69, 10.1016/j.surfcoat.2015.10.025
[5] C.R. Thurber, Y.H. Ahmad, S.F. Sanders, A. Al-Shenawa, N. D’Souza, A.M.A. Mohamed, T.D. Golden Electrodeposition of 70-30 Cu–Ni nanocomposite coatings for enhanced mechanical and corrosion properties Curr. Appl. Phys., 16 (2016), pp. 387-396, 10.1016/j.cap.2015.12.022
[6] M. İbrahim Coşkun, İ.H. Karahan, Y. Yücel, T.D. Golden Computer-assisted optimization of electrodeposited hydroxyapatite coating parameters on medical alloys Metall. Mater. Trans. A, 47 (2016), pp. 1828-1841, 10.1007/s11661-016-3341-x
[7] G.A. Di Bari, Electrodeposition of Nickel, in: M. Schlesinger, M. Paunovic (Eds.), Mod. Electroplat., 1st ed., Wiley, 2010: pp. 79–114. DOI: 10.1002/9780470602638.ch3.
[8] R.-T. Lee, C.-T. Liu, Y.-C. Chiou, H.-L. Chen Effect of nickel coating on the shear strength of FSW lap joint between Ni–Cu alloy and steel J. Mater. Process. Technol., 213 (2013), pp. 69-74, 10.1016/j.jmatprotec.2012.07.014
[9] K.S. Kumar, S. Suresh, M.F. Chisholm, J.A. Horton, P. Wang Deformation of electrodeposited nanocrystalline nickel Acta Mater., 51 (2003), pp. 387-405, 10.1016/S1359-6454(02)00421-4
[10] G. Meng, F. Sun, Y. Shaoa, T. Zhang, F. Wang, C. Dong, X. Li Effect of phytic acid on the microstructure and corrosion resistance of Ni coating Electrochim. Acta, 55 (2010), pp. 5990-5995, 10.1016/j.electacta.2010.05.054
[11] P.T. Tang, T. Watanabet, J.E.T. Andersen, G. Bech-Nielsen Improved corrosion resistance of pulse plated nickel through crystallisation control J. Appl. Electrochem., 25 (1995), 10.1007/BF00249653
[12] M.K. Tripathi, V.B. Singh, H.K. Singh Structure and properties of electrodeposited functional Ni–Fe/TiN nanocomposite coatings Surf. Coat. Technol., 278 (2015), pp. 146-156, 10.1016/j.surfcoat.2015.08.016
[13] F. Xia, M. Wu, F. Wang, Z. Jia, A. Wang Nanocomposite Ni–TiN coatings prepared by ultrasonic electrodeposition Curr. Appl. Phys., 9 (2009), pp. 44-47, 10.1016/j.cap.2007.11.014
[14] W. Cui, K. Wang, K. Wang, P. Wang Effects of jet rate on microstructure, microhardness, and wear behavior of jet electrodeposited Ni–SiC composites Ceram. Int., 44 (2018), pp. 7214-7220, 10.1016/j.ceramint.2018.01.169
[15] A.M. Rashidi, A. Amadeh The effect of current density on the grain size of electrodeposited nanocrystalline nickel coatings Surf. Coat. Technol., 202 (2008), pp. 3772-3776, 10.1016/j.surfcoat.2008.01.018
[16] J.-X. Kang, W.-Z. Zhao, G.-F. Zhang Influence of electrodeposition parameters on the deposition rate and microhardness of nanocrystalline Ni coatings Surf. Coat. Technol., 203 (2009), pp. 1815-1818, 10.1016/j.surfcoat.2009.01.003
[17] A. Godon, J. Creus, X. Feaugas, E. Conforto, L. Pichon, C. Armand, C. Savall Characterization of electrodeposited nickel coatings from sulphamate electrolyte without additive Mater. Charact., 62 (2011), pp. 164-173, 10.1016/j.matchar.2010.11.011
[18] A. Ul-Hamid, H. Dafalla, A. Quddus, H. Saricimen, L.M. Al-Hadhrami Microstructure and surface mechanical properties of pulse electrodeposited nickel Appl. Surf. Sci., 257 (2011), pp. 9251-9259, 10.1016/j.apsusc.2011.04.120
[19] S. Esmailzadeh, S. Khorsand, K. Raeissi, F. Ashrafizadeh Microstructural evolution and corrosion resistance of super-hydrophobic electrodeposited nickel films Surf. Coat. Technol., 283 (2015), pp. 337-346, 10.1016/j.surfcoat.2015.11.005
[20] F. Sun, G. Meng, T. Zhang, Y. Shao, F. Wang, C. Dong, X. Li Electrochemical corrosion behavior of nickel coating with high density nano-scale twins (NT) in solution with Cl− Electrochim. Acta, 54 (2009), pp. 1578-1583, 10.1016/j.electacta.2008.09.047
[21] G. Meng, Y. Li, Y. Shao, T. Zhang, Y. Wang, F. Wang, X. Cheng, C. Dong, X. Li Effect of microstructures on corrosion behavior of nickel coatings: (I) abnormal grain size effect on corrosion behavior J. Mater. Sci. Technol., 31 (2015), pp. 1186-1192, 10.1016/j.jmst.2015.10.011
[22] L. Wang, J. Zhang, Y. Gao, Q. Xue, L. Hu, T. Xu Grain size effect in corrosion behavior of electrodeposited nanocrystalline Ni coatings in alkaline solution Scr. Mater., 55 (2006), pp. 657-660, 10.1016/j.scriptamat.2006.04.009 View article
[23] G. Meng, F. Sun, Y. Shao, T. Zhang, F. Wang, C. Dong, X. Li Influence of nano-scale twins (NT) structure on passive film formed on nickel Electrochim. Acta, 55 (2010), pp. 2575-2581, 10.1016/j.electacta.2009.12.027
[24] L. Qin, J. Lian, Q. Jiang Effect of grain size on corrosion behavior of electrodeposited bulk nanocrystalline Ni Trans. Nonferrous Met. Soc. China, 20 (2010), pp. 82-89, 10.1016/S1003-6326(09)60101-1
[25] M.R. Zamanzad-Ghavidel, K. Raeissi, A. Saatchi The effect of surface morphology on pitting corrosion resistance of Ni nanocrystalline coatings Mater. Lett., 63 (2009), pp. 1807-1809, 10.1016/j.matlet.2009.05.043
[26] L. Jinlong, L. Tongxiang, W. Chen Effect of electrodeposition temperature on grain orientation and corrosion resistance of nanocrystalline pure nickel J. Solid State Chem., 240 (2016), pp. 109-114, 10.1016/j.jssc.2016.05.025
[27] H. Li, L. Xing, Y. Niu, S. Zhu, F. Wang Study of microstructure and corrosion behavior of multilayered Ni coatings by ultrasound-assisted electrodeposition Mater. Res., 23 (2020), Article e20200291, 10.1590/1980-5373-mr-2020-0291
[28] B. Gu, J. Chu, Y. Wang, G. Xu, L. Gao, Y. Yang, Y. Hu, H. Zhang Effects of ultrasonic impact treatment on the corrosion resistance of laser-cladded CrMnFeCoNi high-entropy alloy coatings Surf. Coat. Technol., 489 (2024), Article 131102, 10.1016/j.surfcoat.2024.131102
[29] B. Gu, Y. Wang, G. Xu, L. Gao Effect of ultrasonic impact on the microstructure and properties of 30%WC-Ni ceramic coatings by laser cladding Ceram. Int., 51 (2025), pp. 4677-4692, 10.1016/j.ceramint.2024.11.440
[30] B. Gu, H. Zhang, Y. Wang, G. Xu, C. Wang, L. Gao, J. Chu, Y. Yang Microstructure and corrosion properties of CrMnFeCoNi high entropy alloy coating by temperature field-assisted laser cladding Surf. Coat. Technol., 494 (2024), Article 131473, 10.1016/j.surfcoat.2024.131473
[31] G. Kapoor, L. Péter, É. Fekete, J.L. Lábár, J. Gubicza The influence of Mo addition on the microstructure and its thermal stability for electrodeposited Ni films Mater. Charact., 145 (2018), pp. 563-572, 10.1016/j.matchar.2018.09.026
[32] B. Bakhit, A. Akbari Effect of particle size and co-deposition technique on hardness and corrosion properties of Ni–Co/SiC composite coatings Surf. Coat. Technol., 206 (2012), pp. 4964-4975, 10.1016/j.surfcoat.2012.05.122
[33] L. Wang, Y. Gao, T. Xu, Q. Xue, Corrigendum to “Corrosion resistance and lubricated sliding wear behaviour of novel Ni–P graded alloys as an alternative to hard Cr deposits” Appl. Surf. Sci., 253 (2006), p. 4818, 10.1016/j.apsusc.2006.10.051
[34] M.R. Etminanfar, M. Heydarzadeh Sohi Corrosion resistance of multilayer coatings of nanolayered Cr/Ni electrodeposited from Cr(III)–Ni(II) bath Thin Solid Films 520 (2012), pp. 5322-5327, 10.1016/j.tsf.2012.03.127
[35] M. Srivastava, V. Ezhil Selvi, V.K. William Grips, K.S. Rajam Corrosion resistance and microstructure of electrodeposited nickel–cobalt alloy coatings Surf. Coat. Technol., 201 (2006), pp. 3051-3060, 10.1016/j.surfcoat.2006.06.017
[36] D. Jafarlou, M. Hassan, N.A. Mardi, E. Zalnezhad Influence of temper rolling on tensile property of low Carbon steel sheets by application of hill 48 Anisotropic yield criterion Procedia Eng., 81 (2014), pp. 1222-1227, 10.1016/j.proeng.2014.10.101
[37] Y. Ouyang, J. Liu, Y. Qiu, Z. Cheng The effect of temper rolling and final annealing on microstructure, texture and magnetic properties of non-oriented electrical steels J. Mater. Res. Technol., 20 (2022), pp. 3136-3145, 10.1016/j.jmrt.2022.08.038
[38] S.W. Cheong, E.J. Hilinski, A.D. Rollett Effect of temper rolling on texture formation in a low loss cold-rolled magnetic lamination steel Metall. Mater. Trans. A, 34 (2003), pp. 1311-1319, 10.1007/s11661-003-0242-6
[39] D. Hongshuang, X. Kuangdi, Temper Rolling, in: K. Xu (Ed.), ECPH Encycl. Min. Metall., Springer Nature Singapore, Singapore, 2023: pp. 1–1. DOI: 10.1007/978-981-19-0740-1_737-1.
[40] Y.C. Wang, D.P. Zhao, S.K. Li, J.X. Liu, F.C. Wang The heat treatment effect on microstructure and dynamic mechanical properties of electroformed nanocrystalline Ni–W alloy Mater. Sci. Eng. A, 547 (2012), pp. 104-109, 10.1016/j.msea.2012.03.091
[41] M.V.N. Vamsi, N.P. Wasekar, G. Sundararajan Influence of heat treatment on microstructure and mechanical properties of pulse electrodeposited Ni-W alloy coatings Surf. Coat. Technol., 319 (2017), pp. 403-414, 10.1016/j.surfcoat.2017.03.074
[42] R. Mousavi, M.E. Bahrololoom, F. Deflorian, L. Ecco Improvement of corrosion resistance of Ni Mo alloy coatings: effect of heat treatment Appl. Surf. Sci., 364 (2016), pp. 9-14, 10.1016/j.apsusc.2015.12.041
[43] B. Lü, Z. Hu, X. Wang, B. Xu Thermal stability of electrodeposited nanocrystalline nickel assisted by flexible friction Trans. Nonferrous Met. Soc. China, 25 (2015), pp. 3297-3304, 10.1016/S1003-6326(15)63967-X
[44] S. Julie, M.K. Dash, N.P. Wasekar, C. David, M. Kamruddin Effect of annealing and irradiation on the evolution of texture and grain boundary interface in electrodeposited nanocrystalline nickel of varying grain sizes Surf. Coat. Technol., 426 (2021), Article 127770, 10.1016/j.surfcoat.2021.127770
[45] U. Klement, L. Hollang, S.R. Dey, M. Battabyal, O.V. Mishin, W. Skrotzki Effect of annealing on microstructural development and grain orientation in electrodeposited Ni Solid State Phenom., 160 (2010), pp. 235-240, 10.4028/www.scientific.net/SSP.160.235
[46] G.-L. Song, R. Mishra, Z. Xu Crystallographic orientation and electrochemical activity of AZ31 Mg alloy Electrochem. Commun., 12 (2010), pp. 1009-1012, 10.1016/j.elecom.2010.05.011
[47] P.P. Bhattacharjee, S.K. Sinha, A. Upadhyaya Effect of sintering temperature on grain boundary character distribution in pure nickel Scr. Mater., 56 (2007), pp. 13-16, 10.1016/j.scriptamat.2006.09.003
[48] V. Randle, P.R. Rios, Y. Hu Grain growth and twinning in nickel Scr. Mater., 58 (2008), pp. 130-133, 10.1016/j.scriptamat.2007.09.016
[49] G. Meng, Y. Li, Y. Shao, T. Zhang, Y. Wang, F. Wang, X. Cheng, C. Dong, X. Li Effect of microstructures on corrosion behavior of nickel coatings: (II) competitive effect of grain size and twins density on corrosion behavior J. Mater. Sci. Technol., 32 (2016), pp. 465-469, 10.1016/j.jmst.2015.11.013
[50] A. Laszczyńska, W. Tylus, B. Szczygieł, I. Szczygieł Influence of post−deposition heat treatment on the properties of electrodeposited Ni−Mo alloy coatings Appl. Surf. Sci., 462 (2018), pp. 432-443, 10.1016/j.apsusc.2018.08.160
[51] I. Stoševski, A. Bonakdarpour, S.R. Smith, A. Jacobs, B. Way, D.P. Wilkinson Corrosion of Lithium-ion battery cylindrical cell Hardware: understanding the mechanisms and exploring effective solutions J. Electrochem. Soc., 171 (2024), Article 081502, 10.1149/1945-7111/ad6713
[52] X. Chen, W. Xu, J. Xiao, M.H. Engelhard, F. Ding, D. Mei, D. Hu, J. Zhang, J.-G. Zhang Effects of cell positive cans and separators on the performance of high-voltage Li-ion batteries J. Power Sources, 213 (2012), pp. 160-168, 10.1016/j.jpowsour.2012.04.009
[53] NICKEL-PLATED HEAT-TREATED STEEL SHEET HAVING EXCELLENT PROCESSABILITY AND METHOD OF MANUFACTURING THE SAME, EP 4 012 076 A1, 2022.
[54] ASTM G61-86, Standard Test Method for Conducting Cyclic Potentiodynamic Polarization Measurements for Localized Corrosion Susceptibility of Iron-, Nickel-, or Cobalt-Based Alloys, (2018).
[55] UNI EN ISO 17475, Electrochemical test methods, (2008).
[56] NI-PLATED STEEL SHEET FOR BATTERY CAN HAVING EXCELLENT PRESSABILITY, EP 2 472 631 A1, 2023.
[57] S.J. Splinter, R. Rofagha, N.S. McIntyre, U. Erb XPS Characterization of the corrosion films formed on nanocrystalline Ni-P alloys in sulphuric acid Surf. Interface Anal., 24 (1996), pp. 181-186, 10.1002
[58] T. Watanabe Grain boundary engineering: historical perspective and future prospects J. Mater. Sci., 46 (2011), pp. 4095-4115, 10.1007/s10853-011-5393-z
[59] G. Meng, Y. Shao, T. Zhang, Y. Zhang, F. Wang Synthesis and corrosion property of pure Ni with a high density of nanoscale twins Electrochim. Acta, 53 (2008), pp. 5923-5926, 10.1016/j.electacta.2008.03.070
[60] F. Yang, X. Zhang, H. Yang, Y. Liu, S. Hao, L. Cui Corrosion behavior of electrodeposited Ni with normal and bimodal grain size distribution Trans. Nonferrous Met. Soc. China, 29 (2019), pp. 424-436, 10.1016/S1003-6326(19)64952-6
[61] S. Julie, N.P. Wasekar, P.K. Parida, S. Santra, C. David, M. Kamruddin Effect of grain size on the thermal stability of electrodeposited nanocrystalline nickel: X-ray diffraction studies Thin Solid Films, 745 (2022), Article 139114, 10.1016/j.tsf.2022.139114
[62] F. Czerwinski Diffusion annealing of Fe–Ni alloy coatings on steel substrates J. Mater. Sci., 33 (1998), pp. 3831-3837, 10.1023/A:1004639101022
[63] E. Rahimi, A. Rafsanjani-Abbasi, A. Imani, A. Davoodi TiO2/Cu2O coupled oxide films in Cl− ion containing solution: Volta potential and electronic properties characterization by scanning probe microscopy Mater. Chem. Phys., 212 (2018), pp. 403-407, 10.1016/j.matchemphys.2018.03.066
[64] E. Rahimi, A. Rafsanjani-Abbasi, A. Imani, S. Hosseinpour, A. Davoodi Correlation of surface Volta potential with galvanic corrosion initiation sites in solid-state welded Ti-Cu bimetal using AFM-SKPFM Corros. Sci., 140 (2018), pp. 30-39, 10.1016/j.corsci.2018.06.026
[65] C. Örnek, D.L. Engelberg SKPFM measured Volta potential correlated with strain localisation in microstructure to understand corrosion susceptibility of cold-rolled grade 2205 duplex stainless steel Corros. Sci., 99 (2015), pp. 164-171, 10.1016/j.corsci.2015.06.035
[66] C.P. Couto, R.I. Revilla, R. Politano, I. Costa, Z. Panossian, I. De Graeve, J.L. Rossi, H. Terryn Influence of austenitisation temperatures during hot stamping on the local electrochemical behaviour of 22MnB5 steel coated with hot-dip Al-Si Corros. Sci., 190 (2021), Article 109673, 10.1016/j.corsci.2021.109673
[67] C. Örnek, C. Leygraf, J. Pan On the Volta potential measured by SKPFM – fundamental and practical aspects with relevance to corrosion science Corros. Eng. Sci. Technol., 54 (2019), pp. 185-198, 10.1080/1478422X.2019.1583436
[68] W. Melitz, J. Shen, A.C. Kummel, S. Lee Kelvin probe force microscopy and its application Surf. Sci. Rep., 66 (2011), pp. 1-27, 10.1016/j.surfrep.2010.10.001 View article
[69] E. Rahimi, A. Imani, M. Lekka, F. Andreatta, Y. Gonzalez-Garcia, J.M.C. Mol, E. Asselin, L. Fedrizzi Morphological and Surface potential Characterization of protein nanobiofilm formation on magnesium alloy oxide: their role in biodegradation Langmuir, 38 (2022), pp. 10854-10866, 10.1021/acs.langmuir.2c01540
[70] M. Mousavi, E. Rahimi, J.M.C. Mol, Y. Gonzalez-Garcia The effect of phosphorous content on the microstructure and localised corrosion of electroless nickel-coated copper Surf. Coat. Technol., 492 (2024), Article 131174, 10.1016/j.surfcoat.2024.131174
[71] C.E. Dubé, B. Workie, S.P. Kounaves, A. Robbat, M.L. Aksub, G. Davies Electrodeposition of metal alloy and mixed oxide films using a single‐precursor Tetranuclear copper‐nickel complex J. Electrochem. Soc., 142 (1995), pp. 3357-3365, 10.1149/1.2049987
[72] M.C. Biesinger, B.P. Payne, L.W.M. Lau, A. Gerson, R.St.C. Smart X‐ray photoelectron spectroscopic chemical state quantification of mixed nickel metal, oxide and hydroxide systems Surf. Interface Anal., 41 (2009), pp. 324-332, 10.1002/sia.3026
[73] R. Nishimura Pitting corrosion of nickel in borate and phosphate solutions Corrosion, 43 (1987), pp. 486-492, 10.5006/1.3583891
[74] L. Zhang, D.D. Macdonald Segregation of alloying elements in passive systems—I. XPS studies on the Ni–W system Electrochim. Acta, 43 (1998), pp. 2661-2671, 10.1016/S0013-4686(97)00268-5
[75] E. Sikora, D.D. Macdonald Nature of the passive film on nickel Electrochim. Acta, 48 (2002), pp. 69-77, 10.1016/S0013-4686(02)00552-2
[76] C.A. Melendres, M. Pankuch On the composition of the passive film on nickel: a surface-enhanced Raman spectroelectrochemical study J. Electroanal. Chem., 333 (1992), pp. 103-113, 10.1016/0022-0728(92)80384-G
[77] X. Wu, R. Pandey, J. Zhang, F. Polo-Garzon, F.C. Robles Hernandez, R. Krishnamoorti, P. Bollini Surface hydration of porous nickel hydroxides facilitates the reversible adsorption of CO2 from ambient air JACS Au 5 (2025), pp. 1649-1662, 10.1021/jacsau.4c01083
[78] D.S. Hall, D.J. Lockwood, C. Bock, B.R. MacDougall Nickel hydroxides and related materials: a review of their structures, synthesis and properties Proc. R. Soc. Math. Phys. Eng. Sci., 471 (2015), Article 20140792, 10.1098/rspa.2014.0792
[79] N. Priyantha, P. Jayaweera, D.D. Macdonald, A. Sun An electrochemical impedance study of alloy 22 in NaCl brine at elevated temperature. I. Corrosion behavior J. Electroanal. Chem., 572 (2004), pp. 409-419, 10.1016/j.jelechem.2004.06.031
[80] G. Rondelli In vitro corrosion study by EIS of a nickel-free stainless steel for orthopaedic applications Biomaterials, 26 (2005), pp. 739-744, 10.1016/j.biomaterials.2004.03.012
[81] C.M.A. Brett, A.M. Oliveira Brett, Electrochemistry: principles, methods, and applications, 1. publ. 19993, reprinted 2005, Oxford Univ. Press, Oxford, 2005.
[82] J.R. Macdonald, ed., Impedance spectroscopy: emphasizing solid materials and systems, 2. [print.], Wiley, New York, 1987.
[83] L. Liu, Y. Li, F. Wang Influence of micro-structure on corrosion behavior of a Ni-based superalloy in 3.5% NaCl Electrochim. Acta, 52 (2007), pp. 7193-7202, 10.1016/j.electacta.2007.05.043
[84] Z. Xiao, Z. Li, A. Zhu, Y. Zhao, J. Chen, Y. Zhu Surface characterization and corrosion behavior of a novel gold-imitation copper alloy with high tarnish resistance in salt spray environment Corros. Sci., 76 (2013), pp. 42-51, 10.1016/j.corsci.2013.05.026
[85] K.M.S. Youssef, C.C. Koch, P.S. Fedkiw Improved corrosion behavior of nanocrystalline zinc produced by pulse-current electrodeposition Corros. Sci., 46 (2004), pp. 51-64, 10.1016/S0010-938X(03)00142-2
[86] H. Alimadadi, A.B. Fanta, T. Kasama, M.A.J. Somers, K. Pantleon Texture and microstructure evolution in nickel electrodeposited from an additive-free Watts electrolyte Surf. Coat. Technol., 299 (2016), pp. 1-6, 10.1016/j.surfcoat.2016.04.068
[87] S. Melzer, J. Moerman, Diffraction Techniques in Steel Research: An Overview, in: A. Haldar, S. Suwas, D. Bhattacharjee (Eds.), Microstruct. Texture Steels, Springer London, London, 2009: pp. 267–284. DOI: 10.1007/978-1-84882-454-6_16.
[88] H. Park, J.A. Szpunar The role of texture and morphology in optimizing the corrosion resistance of zinc-based electrogalvanized coatings Corros. Sci., 40 (1998), pp. 525-545, 10.1016/S0010-938X(97)00148-0
[89] Í. Carneiro, S. Simões Recent advances in EBSD Characterization of metals Metals, 10 (2020), p. 1097, 10.3390/met10081097
[90] T. Watanabe, S. Tsurekawa The control of brittleness and development of desirable mechanical properties in polycrystalline systems by grain boundary engineering Acta Mater., 47 (1999), pp. 4171-4185, 10.1016/S1359-6454(99)00275-X
[91] K. Harada, S. Tsurekawa, T. Watanabe, G. Palumbo Enhancement of homogeneity of grain boundary microstructure by magnetic annealing of electrodeposited nanocrystalline nickel Scr. Mater., 49 (2003), pp. 367-372, 10.1016/S1359-6462(03)00329-4
[92] T. Watanabe, H. Fujii, H. Oikawa, K.I. Arai Grain boundaries in rapidly solidified and annealed Fe-6.5 mass% Si polycrystalline ribbons with high ductility Acta Metall., 37 (1989), pp. 941-952, 10.1016/0001-6160(89)90021-7
[93] T. Watanabe, S. Tsurekawa, X. Zhao, L. Zuo, The Coming of Grain Boundary Engineering in the 21st Century. In: A. Haldar, S. Suwas, D. Bhattacharjee (Eds.). Microstruct. Texture Steels, Springer London, London, 2009: pp. 43–82. DOI: 10.1007/978-1-84882-454-6_4.
[94] G. Palumbo, E.M. Lehockey, P. Lin Applications for grain boundary engineered materials JOM, 50 (1998), pp. 40-43, 10.1007/s11837-998-0248-z
[95] W. Li, B. Yu, J. Tam, J.D. Giallonardo, D. Doyle, D. Poirier, J.-G. Legoux, P. Lin, G. Palumbo, U. Erb Microstructural characterization of copper coatings in development for application to used nuclear fuel containers J. Nucl. Mater., 532 (2020), Article 152039, 10.1016/j.jnucmat.2020.152039
[96] P. Marcus, V. Maurice, H.-H. Strehblow Localized corrosion (pitting): a model of passivity breakdown including the role of the oxide layer nanostructure Corros. Sci., 50 (2008), pp. 2698-2704, 10.1016/j.corsci.2008.06.047
[97] Z. Xue, W. Lei, Y. Wang, H. Qian, Q. Li Effect of pulse duty cycle on mechanical properties and microstructure of nickel-graphene composite coating produced by pulse electrodeposition under supercritical carbon dioxide Surf. Coat. Technol., 325 (2017), pp. 417-428, 10.1016/j.surfcoat.2017.07.017
[98] J.J. Gray, B.S. El Dasher, C.A. Orme Competitive effects of metal dissolution and passivation modulated by surface structure: an AFM and EBSD study of the corrosion of alloy 22 Surf. Sci., 600 (2006), pp. 2488-2494, 10.1016/j.susc.2006.04.002
[99] X.X. Wei, B. Zhang, B. Wu, Y.J. Wang, X.H. Tian, L.X. Yang, E.E. Oguzie, X.L. Ma Enhanced corrosion resistance by engineering crystallography on metals Nat. Commun., 13 (2022), p. 726, 10.1038/s41467-022-28368-8
[100] N. Kanani, ed., Electroplating: basic principles, processes and practice, Elsevier Advanced Technology, Oxford, 2004.