


The adoption of chrome-free anodizing and sealing systems for aluminum alloys, particularly AA2024, is gaining prominence due to environmental and health concerns associated with traditional Cr(VI)-based processes.
 Norica Godja and Florentina-Daniela MunteanuThis study evaluates the environmental and economic impacts of sulfuric acid anodizing (SAA) combined with sealing based on fluorozirconate, molybdate, and cerate. Comparative analyses were conducted against conventional Cr(VI) systems and SAA with Cr(III) sealing, focusing on corrosion resistance, energy consumption, washing steps and material flows. The entire anodizing process was examined, including pretreatment, anodization, and sealing. Electrochemical analyses and surface characterization through SEM/EDS, FIB, and XPS were conducted. The results demonstrate that the chromium-free system offers competitive corrosion resistance while significantly reducing environmental and economic costs. Furthermore, fluorozirconate, molybdate, and cerate-based post-treatments broaden its application spectrum in corrosion science and warrant further exploration. However, adopting new sealing technologies in aerospace requires extensive certification involving corrosion resistance, durability assessments, and stringent environmental simulations.
Compliance with regulatory standards set by the FAA (Federal Aviation Administration) and EASA (European Union Aviation Safety Agency) necessitates thorough documentation, third-party validation, and testing to ensure safety and performance before industrial implementation. These challenges underscore the complexity of transitioning to more sustainable anodizing and sealing technologies in the aerospace industry.
1. Introduction
In aerospace, anodizing and sealing are essential surface treatments for aluminum alloys, ensuring corrosion resistance, durability, and reliability under extreme conditions. Strict regulations drive advancements in these processes, notably the transition to greener technologies to minimize environmental impact.
A key challenge is replacing chromium-based coatings (Cr(VI)) with safer alternatives like Cr(III) or Cr-free systems while maintaining performance and cost effectiveness. This multi-decade transition involves research, testing, validation, and certification, typically spanning 20 years to ensure full integration into aircraft systems [1]. Despite the extended timeline, the benefits include reduced emissions, resource conservation, and improved sustainability.
Chromates are used in pretreatment, anodization, sealing, and aerospace primers. Examples include the MAPAERO P60 epoxy primer with strontium chromate and the PPG PAC3 polyurethane primer with chromate. A chromate-free alternative is the PPG CA 7521 epoxy primer. Potential chromate-containing processes (products) related to pretreatment, anodizing, sealing, and painting are highlighted in red in Figure 1.
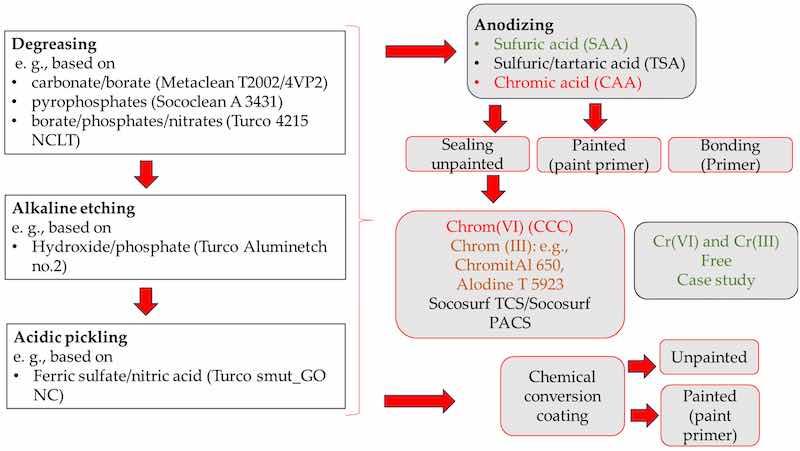
Figure 1. Identification of chromate-containing products in aerospace: pretreatment, sealing, conversion coating, and primers.
AA2024 is the most widely used aluminum alloy in aerospace, due to its high strength-to-weight ratio, fatigue resistance, and machinability. However, its corrosion susceptibility necessitates surface treatments like anodizing and sealing to enhance durability [2,3]. As environmental regulations become more stringent, greener alternatives to traditional coatings are being developed to ensure compliance while maintaining the high-performance standards required for aerospace applications. Significant efforts have been made to create sustainable sealing strategies in aluminum anodizing, focusing on enhancing energy efficiency and corrosion resistance, as highlighted in the existing literature [4].
The surface treatment process (Figure 2) includes several steps: pretreatment, which involves degreasing, pickling, and desmutting to clean and prepare the surface, anodizing, which forms a protective oxide layer for increased hardness and corrosion resistance, and sealing, which closes pores, further improving protection against wear and environmental factors.

Figure 2. Process flow diagram: pretreatment, anodization, and post-treatment, such as sealing/conversion coatings. In between the different steps of pretreatment, anodization, sealing, and after sealing, rinsing with water must be performed, with water quality depending on the industrial process.
Pretreatment, Anodization, and Sealing Procedures
Commercial cleaning and etching products are widely available on the market (Figure 3a). Their composition varies depending on the application, often containing acids, alkalis, or specialized additives to achieve desired surface properties. Eliminating borate from alkaline degreasing agents will be especially beneficial for aluminum anodizing plants, as they are legally required to remove borate from their wastewater [5].
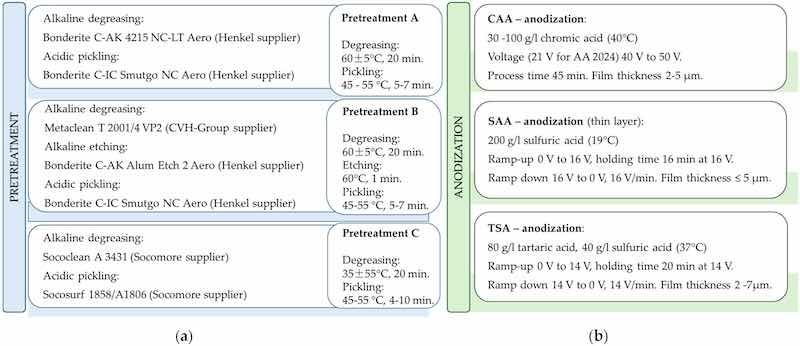
Figure 3. Surface preparation (a) before anodization, including cleaning and etching with commercial products, and (b) anodization procedures in aerospace.
Pickling is a critical step in the pretreatment of AA2024-T3. NaOH etching of AA2024-T3 releases Al2CuMg and Al7CuFe particles, forming a hydroxide layer, while HNO3 pickling dissolves it, increasing the surface copper content and affecting corrosion resistance, as shown by O. Gharbi [6]. Local corrosion in AA2024 begins at cathodic intermetallic compounds (IMPs) through dealloying, driven by nanogalvanic interactions, with corrosion kinetics controlled by the electrochemical stability of IMPs rather than their potential difference with the matrix, as investigated by A. Kosari et al. [7]. Redeposited copper accelerates degradation, while elements like Al and Si limit reactivity by forming isolating corrosion products. Therefore, optimized pickling compositions are essential to effectively remove detrimental intermetallic particles, regulate surface copper content, and enhance corrosion resistance while maintaining the integrity of the aluminum substrate.
Chromic acid anodizing (CAA) is used in aviation due to its excellent corrosion resistance properties [8]. Replacing hexavalent chromium remains challenging due to gaps in our understanding of coating degradation and effective alternatives [9]. Alternatively, sulfuric acid anodizing (SAA) and the combination of sulfuric acid and tartaric acid (TSAA) serve as viable solutions [9,10]. The typical parameters for anodizing baths include the bath composition, operating conditions, and target layer thicknesses (Figure 3b).
After anodizing, the aluminum surface becomes porous, making it vulnerable to environmental degradation. Sealing is applied to protect and enhance its properties, closing these pores and improving corrosion resistance, durability, and appearance.
Cr(VI)-based sealants have long been used for superior corrosion protection, but their use is declining due to environmental and health concerns. Cr(III)-based sealants provide an effective and more environmentally compliant alternative, commonly used in aerospace, industrial, and architectural applications. Nickel acetate [11] and cobalt acetate are widely applied for their corrosion resistance and color stability, particularly on dyed anodized surfaces. Chromium-free alternatives include hot water or steam sealing, which hydrates the aluminum oxide layer to enhance durability. Recent advancements have explored zirconium, titanium, cerium [12,13,14], lithium salts, nanocontainers loaded with corrosion inhibitors, hybrid sol–gel coatings, and energy-efficient photopolymerization techniques [15]. Silicate-based [12] and polymer-based sealants offer additional protection, while fluorozirconate sealing has shown promise in alkaline environments [16,17,18,19]. Emerging Cr-free solutions, including low-temperature and fluoride-free chemistries [4], are gaining interest, along with layered double hydroxides [20] and alkaline earth metal salts [21], for high-performance corrosion resistance.
Molybdate-based coatings are effective corrosion inhibitors, interacting with various anions and cations to form a protective barrier. Molybdate adsorption on oxide films repairs defects and pores, preventing localized corrosion [22,23,24]. These coatings are non-crystalline MoOx (2 ≤ x ≤ 3) [25,26], with MoO3 enhancing anodic inhibition by shifting the pitting potential higher. The oxidation–reduction mechanism involves the initial formation of MoO2, which re-oxidizes in steps to MoO3 over intermetallic particles. Molybdenum-based compositions with titanium and zirconium enhance conversion layers on aluminum substrates such as the 6061 alloy [27], forming a two-layer structure with an oxidized Mo(VI) surface and a reduced Mo(IV)/Mo(V) inner layer [28]. Additionally, H2ZrF6, Na2MoO4, and KMnO4 have been studied as corrosion-resistant sealing agents for aluminum alloys [29]. Furthermore, corrosion inhibition in aluminum alloys can be achieved using molybdate ions and Li-based inhibitors, which are gaining attention for their effectiveness in various applications [30,31].
Cerium-based coatings (CeCCs) protect corrosion by precipitating cerium oxides and hydroxides at cathodic sites, driven by local pH increases. Ce(NO3)3 preferentially deposits in defect areas within oxide coatings, and H2O2 has been used to assist CeCC formation by increasing pH at copper-rich sites [32]. The effectiveness of cerium varies by alloy type, but it works synergistically with molybdenum, where Ce oxides reinforce the hydrated aluminum oxide film and Mo species act as active inhibitors [12,33]. Mechanisms for these conversion coatings are influenced by intermetallics’ anodic or cathodic nature [34,35]. Carangelo et al. demonstrated that a modified TSA anodizing cycle combined with cerium sealing resulted in corrosion protection comparable to or superior to chromate-sealed TSA [36].
Commercial Cr(III)-based sealing products include SurTec 650 ChromitAL® (SurTec International GmbH, Bensheim, Germany), a globally recognized TCP (trivalent chromium passivation) benchmark based on a NAVAIR patent, Chemeon TCP-HF from Chemetall (Chemetall, New Providenc, NJ, USA), and Alodine T 5923 from Henkel (Henkel, Düsseldorf, Germany). Chromium-free sealing alternatives include Socosurf TCS/PACS from Socomore (Socomore, Vannes, France).
Cr(VI)- and Cr(III)-based sealing serve as references for the proposed Cr-free sealing (Figure 4) in the environmental impact assessment, considering heating costs, chemical composition, and Annex VI REACh-listed substances to ensure compliance and promote sustainable alternatives (see Section 3.5).
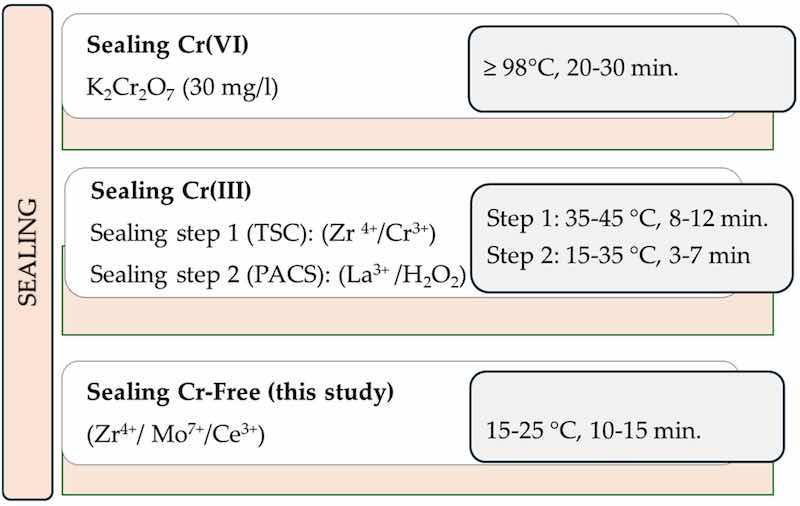
Figure 4. Sealing solutions for aluminum anodic layers, including Cr(VI) and Cr(III) commercial products from Socomore, as a reference, and the Cr-free alternative proposed in this study.
The specific requirements for these processes must align with industry standards to guarantee that the finished components can withstand these challenges (Table 1).
Table 1. The requirements for thin SAA anodizing with sealing for potential applications in the aeronautic sector.
| Control | Test Methods | Thin SAA Sealed |
| Aspect | Visual | No powdering; uniform |
| Thickness | ISO 1463; ISO 2360 | 3–7 µm |
| Weight | ASTM B 137 or MIL A 8625 | Thin SAA: >22 mg/dm2 |
| Loss of absorbing power (control of sealing) | ISO 2143 | No persistence of the colorant patch (patch intensity: 0 or 1) * |
| Corrosion resistance | NF EN ISO 9227 or ASTM B 117 | After 750 h salt spray test: five pits maximum; Each sample will not present more than five pits with diameters smaller than 0.78 mm on a surface of 120 × 80 mm2 as the standard; Samples are tilted between 15° and 25° as required by NF EN ISO 9227 |
| Layer continuity | ISO 2085 | No black point |
2. Materials and Methods
2.1. Materials
The following chemicals and products were used in this study: sulfuric acid (96%) from Carl Roth (Carl Roth, Karlsruhe, Germany); sodium molybdate dihydrate (NaMoO4·2H2O), cerium nitrate hexahydrate (Ce(NO3)3·6H2O), and potassium hexafluorozirconate (K2ZrF6) from Sigma-Aldrich (Sigma-Aldrich, Burlington, MA, USA). Sococlean A 3431 and Socosurf 1858/A1806 were also obtained from Socomore (Socomore, Vannes, France). Aluminum AA 2024 T3 sheets with a dimension of 100 × 150 × 2 mm were used in this study.
2.2. Method
2.2.1. Surface Analysis Methods
The morphology, structure, and surface composition of the samples were analyzed before and after corrosion testing using a dual-beam scanning electron microscope/focused ion beam system (SEM/FIB LYRA I XMU, TESCAN, Dortmund, Germany) equipped with an EDX detector (Quantax 200, Bruker, Billerica, MA, USA).
Since corrosion resistance largely depends on surface elements’ chemical composition and oxidation state, X-ray photoelectron spectroscopy (XPS) was also conducted to provide detailed insights into surface changes caused by corrosion, as it analyzes depths of 3–5 nm. In contrast, EDX analysis, with a 3–5 µm penetration depth, characterizes the bulk composition. This difference in analytical depth means that EDX data may partially affect interpretations of the oxidation–reduction reactions occurring during corrosion.
A focused ion beam (FIB) system (Quanta 200 3D, Thermal Fisher Scientific, Waltham, MA, USA) was employed to characterize the anodic layer, allowing precise cross-sectioning and high-resolution imaging for detailed analysis of the layer’s thickness, uniformity, and microstructural features. The samples were first cooled in liquid nitrogen before pore measurements were taken. This step ensured that the samples were brittle enough for precise cross-sectional analysis and accurate pore size evaluation.
The aluminum alloy AA 2024 was analyzed before the pretreatment to determine intermetallic nanoparticles’ surface morphology and composition and again after the pretreatment, anodizing, and sealing.
Following anodizing and sealing, electrochemical measurements were performed to evaluate layer performance, including polarization resistance and chronoamperometry.
2.2.2. Electrochemical Characterization
The corrosion behavior of the anodized AA2024 samples was assessed using several electrochemical methods.
Potentiodynamic polarization measurements were conducted under quasi-stationary conditions (scan rate ≤ 1 mV/s), with anodic and cathodic polarization curves recorded for individual samples in a three-electrode thermostatted electrochemical cell at 25 °C. The electrolyte was 0.1 M NaCl, with a platinum counter electrode and an Ag/AgCl (3M KCl) reference electrode (E = +0.210 V vs. SHE, referenced to SCE). Measurements were performed using a Gamry Interface 1000 Potentiostat/Galvanostat/ZRA (Gamry Instruments, Warminster, PA, USA) with a potential sweeping rate of 0.5 mV/s, starting from the open circuit potential (Eocp) after 30 min of immersion in the NaCl solution. Corrosion current density (icorr) was determined using Tafel extrapolation of the anodic polarization curve.
Chronoamperometric analysis: “i–τ” curves were recorded for as-deposited samples after 1 h of exposure in 0.1 M NaCl, with measurements conducted just below the breakdown potential (Epitt) identified from potentiodynamic polarization curves.
The polarization resistance (Rp) method was used to monitor the evolution of corrosion resistance (Rp) over exposure times ranging from 1 h to 216 h in the NaCl solution. This method correlates polarization resistance (Rp) with corrosion current (icorr) based on the Stern–Geary Equation (1), where Rp is the polarization resistance, βa and βc are constants representing the slopes of the Tafel area of the anodic and cathodic polarization curves, respectively, and icorr is the corrosion current:
𝑅𝑝 = [𝛽𝑎.𝛽𝑐]/[2.303.𝑖𝑐𝑜𝑟𝑟(𝛽𝑎+𝛽𝑐)] (1)
Polarization resistance measurements were performed using a Gamry Interface 1000 with the Corrosion Technique Software (Gamry DC105, Gamry PHE200). A ±15 mV scan range relative to Ecorr was applied, with an initial stabilization period of 15 min at 25 ± 0.5 °C. The exposed surface area of the specimens was 5 cm2, and all tests were conducted in 0.1 M NaCl. Higher Rp values (Ω·cm2) indicate better corrosion resistance and lower corrosion current (icorr), reinforcing the method’s relevance for evaluating corrosion behavior in real-world conditions.
A salt spray test (SST) was conducted according to DIN EN ISO 9227 with a total duration of 768 h and visual inspections after 24, 48, 72, 192, 336, 504, 672, and 768 h. The apparatus for salt spray testing consists of a closed testing chamber, where a salted solution containing 50 g/l sodium chloride is atomized (converted to an aerosol) by forcing the solution through a fine nozzle. Thus, a corrosive environment of sodium–chloride-containing fog is achieved so that the exposed parts face a severely corrosive atmosphere.
2.2.3. Environmental and Economic Study of Different Sealing Processes for Anodized Aluminum
This study evaluates materials in sealing compositions and energy flows/heating costs in treatment processes, focusing on energy consumption and the environmental impact of chemicals used in sealing. The approach targets energy efficiency and cost-effectiveness, providing insights into operational demands and resource utilization without extensive environmental impact analysis.
The study compares the environmental and economic impacts of various sealing processes for anodized aluminum, specifically evaluating chromium-free sealing compositions with fluorozirconate (Zr/F), molybdate (Mo), and cerate (Ce) alongside conventional Cr(VI) and Cr(III) sealing.
3. Results
3.1. Pretreatment and Thin Sulfuric Anodization
In this study, sulfuric acid-based anodizing (SAA) with a thin oxide layer (≤5 µm), which is preferred for critical aerospace components to maintain high fatigue strength, was combined with chromium-free sealing based on hexafluorozirconate, molybdenum, and optional cerium compounds. Commercial products were used for the pretreatment (Table 2).
Table 2. Pretreatment solutions with intermediate rinsing: rinsing tank (5 min) and spray rinse.
| Preparation of Work | Product Supplier | Parameters |
| Alkaline degreasing | Sococlean A3431 10% (Socomore; Vannes; France) | 20 min; 45 °C |
| Intermediate rinsing | Water quality grade according to AIMS09-00-003 (grade A) | 5 min; RT |
| Etching | Socosurf 1858 (40%) + Socosurf 1806 (10%) (Socomore; Vennes; France) | 10 min; 55 °C |
| Intermediate rinsing | Water quality grade according to AIMS09-00-003 (grade A) | 5 min; RT |
Table 3 outlines the anodizing parameters employed for the thin SAA process in this study.
Table 3. SAA anodization solution and parameters for AA2024.
| Bad Composition | g/L | Rinse Time | Temperature (°C) | Voltage |
| H2SO4 | 200 | 5 min and 20 s | 18–20 Optimum 19 | Voltage during dwell time: 16 V; Dwell time: 16 min; Drop time: 1 min |
The water quality used in the experimental part was grade A (pure water). For industrial applications, water quality B and C could be used (as shown in Table 4), depending on the specific process employed.
Table 4. Water quality parameters used in aerospace coating technologies.
| Parameters | Quality A+ | Quality A | Quality B | Quality C |
| Description | Pure water | Pure water | Industrial water I | Industrial water II |
| pH at 25 °C | 5.5 to 7.0 | 5.0 to 7.0 | 5.0 to 8.5 | 5.0 to 9.0 |
| Total residue (mg/L) | ≤20 | ≤20 | ≤400 | ≤400 |
| Conductivity (μS/cm) | <2 | ≤20 | ≤400 | ≤750 |
| Cl− (mg/L) | - | - | - | ≤100 |
| Description | Pure water | Pure water | Industrial water I | Industrial water II |
3.2. Chromium-Free Sealing Development and Electrochemical Characterization
Based on the literature [29,31] and patents [37,38], the potential application of molybdenum and cerium in combination with potassium zirconium hexafluoride in the sealing composition was studied, along with room-temperature sealing to reduce heating costs. Electrochemical measurements were conducted to determine the optimal concentration for achieving good anticorrosion properties, initially testing each sealing component separately. The electrochemical parameters derived from the Tafel plots for three different concentrations of K2ZrF6 are presented in Table 5. These parameters provide insights into the corrosion behavior and the efficiency of K2ZrF6 as a corrosion inhibitor under varying concentrations. Three different concentrations for each component (K2ZrF6, NaMoO4·2H2O, and Ce(NO3)3·6H2O) were evaluated, and the results correlating to the salt spray tests after 72 h are presented in Figure 5a–c.
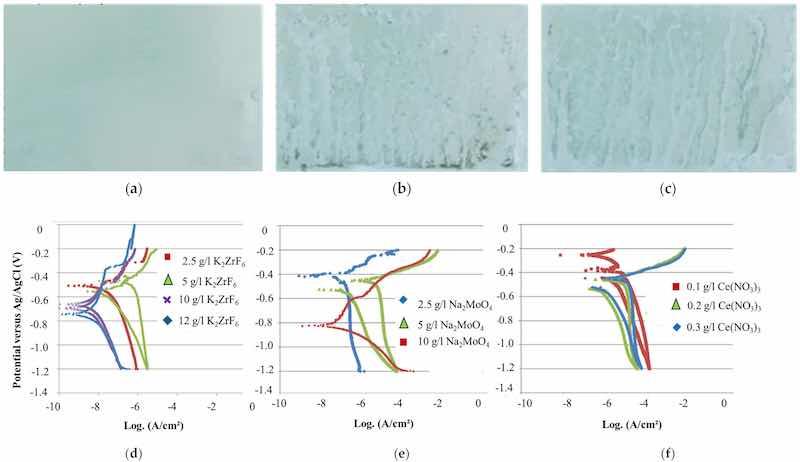
Figure 5. Sample appearance after 72 h SST of thin-SAA anodizing (4.3–4.7 µm) and 15 min sealing at room temperature with (a) Zr/F sealing at pH 5, (b) Mo sealing at pH 7.3, and (c) Ce sealing at pH 5.6. Potentiodynamic polarization curves of anodized aluminum alloy 2024 with (d) Zr/F, (e) Mo, and (f) Ce sealing.
Table 5. The electrochemical parameters calculated from the Tafel plots for three different concentrations of K2ZrF6 are compared with a sample that was not anodized and a sample that underwent thin-SAA anodizing, and samples treated with SAA containing 10 g/L Mo and 0.5 g/L Ce.
| Sample | Ecorr vs. Ag/Ag/Cl (3M KCl) (V) | Icorr (A/cm2) | P.E. % |
| AA 2024—cleaning; pickling | −0.590 | 5 × 10⁻⁴ | - |
| SAA | −0.550 | 1 × 10⁻⁷ | 99.98 |
| SAA with 0.5 g/L Ce(NO3)3 | −0.454 | 4 × 10⁻⁷ | 99.92 |
| SAA with 10 g/Na2MoO4 | −0.828 | 7 × 10⁻⁸ | 99.99 |
| SAA with 5 g/L K2ZrF6 | −0.540 | 9 × 10⁻⁸ | 99.98 |
| SAA with 10 g/L K2ZrF6 | −0.660 | 4 × 10⁻⁹ | 100.00 |
| SAA with 12 g/L K2ZrF6 | −0.780 | 2 × 10⁻⁹ | 100.00 |
The protection efficiency (P.E%) of the sealing was obtained on the basis of Icorr as follows [39]:
P.E. % = [(1−𝐼 𝑐𝑜𝑟𝑟 𝑐𝑜𝑎𝑡𝑖𝑛𝑔)/(𝐼 𝑐𝑜𝑟𝑟 𝑤𝑖𝑡ℎ𝑜𝑢𝑡 𝑐𝑜𝑎𝑡𝑖𝑛𝑔)] × 100% (2)
The shift of the corrosion potential toward more negative values with increasing K2ZrF6 concentrations indicates inhibition of the cathodic reaction, specifically oxygen reduction. A lower corrosion current and a higher pitting potential are observed at higher concentrations, suggesting improved corrosion resistance.
The optimal Na2MoO4 concentration, based on the potentiodynamic polarization curves, is 10 g/L. The tested concentrations were 2.5 g/L (pH 6.9), 5 g/L (pH 7.2), and 10 g/L (pH 7.3).
No significant difference in corrosion behavior was observed with varying sealing concentrations of Ce(NO3)3·3H2O (0.1 g/L at pH 5.7, 0.2 g/L at pH 5.6, and 0.5 g/L at pH 5.5).
After anodization, the oxide layers ranged between 4.3 and 4.7 µm for all samples. Three parallel samples were tested for each sealing composition to ensure consistency and reliability in the results. The sample appearance after a 72 h salt spray test (SST) with one component is depicted in the figure below, showing that fluorozirconate sealing is more effective than molybdate or cerate sealing.
The sealing compositions shown in Table 6 (mixtures 1, 2, and 3) were applied after thin sulfuric acid anodization (SAA). The resulting coatings were extensively characterized using SEM/EDS, XPS, and electrochemical measurements. The most effective mixture was further assessed through salt spray testing (SST) to compare the results with those of Cr(III) commercial sealing and hot water sealing (HWS).
Table 6. Test matrix. Composition and conditions for the preparation of the studied samples.
| Sealing | Sample No. | Samples Description | Sealing Parameters |
| - | 1 | AA2024—according ASTM B 211 | - |
| - | 2 | AA2024 after pretreatment | - |
| - | 3 | Pretreatment + SAA without sealing | - |
| Mixture 1 (Zr/F; Mo) | 4 | K2[ZrF6] (12 g/L) + Na2MoO4·2H2O (10 g/L) | RT; 15 min; pH value of 6.25 |
| Mixture 2 (Zr/F; Ce) | 7 | K2[ZrF6] (12 g/L) + Ce(NO3)3·6H2O (0.2 g/L) | RT; 15 min; pH value of 4.84 |
| Mixture 3 (Zr/F; Mo; Ce) | 10 | K2[ZrF6] (12 g/L) + Na2MoO4·2H2O (10 g/L) + Ce(NO3)3·6H2O (0.2 g/L) | RT; 15 min; pH value of 5.96 |
The obtained chronoamperograms for studied samples are depicted in Figure 6 and Figure 7.
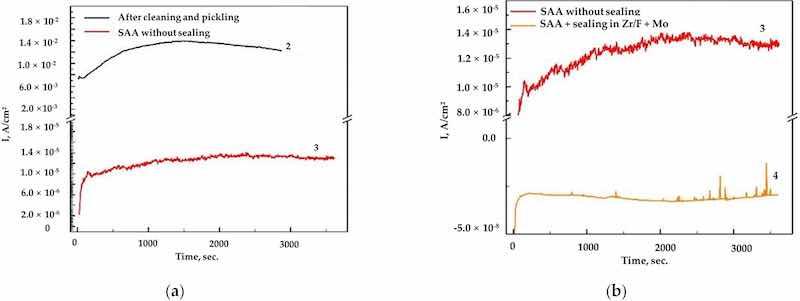
Figure 6. (a) The obtained chronoamperograms for AA2024, samples 2 (after cleaning and pickling) and 3 (SAA) at E = −0.400 V vs. Ag/AgCl (3M KCl); (b) sample 3 (SAA) at E = −0.400 V vs. Ag/AgCl (3M KCl) and sample 4 ((SAA + (Zr/F + Mo)) at E = −0.700 V vs. Ag/AgCl (3M KCl).
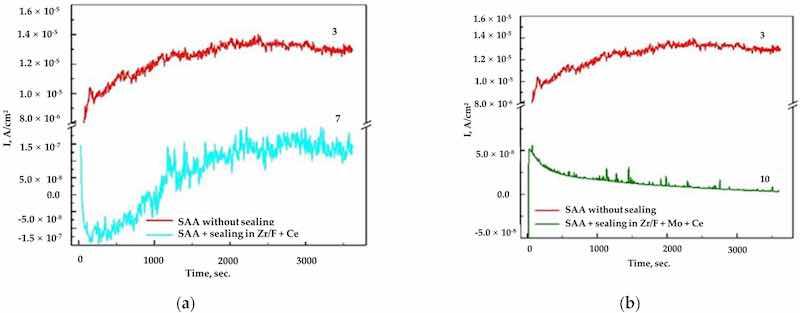
Figure 7. (a) The obtained chronoamperograms for AA2024, sample 3 (SAA) at E = −0.400 V vs. Ag/AgCl (3M KCl) and sample 7 ((SAA +(Zr/F + Ce)) at E = −0.700 V vs. Ag/AgCl (3M KCl); (b) sample 3 (SAA) at E = −0.400 V vs. Ag/AgCl (3M KCl) and sample 10 ((SAA + (Zr/F + Mo + Ce)) at E = −0.700 V vs. Ag/Ag/Cl (3M KCl).
The potentiodynamic cathodic and anodic E–log I curves recorded in 0.1 M NaCl solution, using six parallel samples for each surface treatment (three tested under cathodic polarization and three under anodic polarization), are shown in Figure 8.
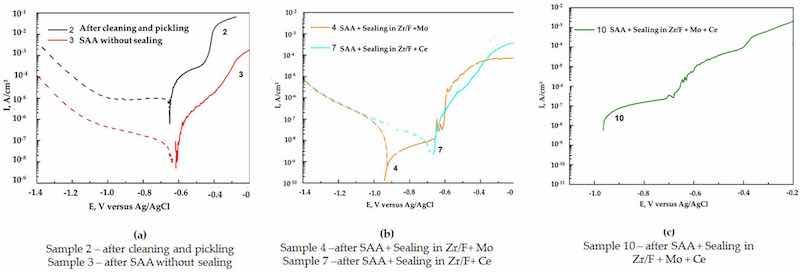
Figure 8. Potentiodynamic cathodic and anodic E-Log i curves in 0.1 M NaCl. Six parallel samples for each treatment were tested as follows: three potentiodynamic cathodic samples and three potentiondynamic anodic samples. (a) Comparison of sample 2 (cleaning + pickling) with sample 3 (SAA); (b) comparison of sample 4 (SAA + (Zr/F + Mo)) with sample 7 (SAA + (Zr/F +Ce); (c) anodic E-Log I curve for sample 10 (SAA + (Zr/F + Mo + Ce)).
The electrochemical characteristics of the studied samples, determined from the potentiodynamic polarization curves, are presented in Table 7.
Table 7. Electrochemical parameters of the studied samples established on the basis of the potentiodynamic polarization curves: E1—potential value, found immediately after the immersion of the samples in 0.1 M NaCl; Ecorr—corrosion potential; Epitt—breakdown potential; ipitt—current at breakdown potential; icorr—corrosion current; Epass—potential of area of passivity; ipass—current at passivity area; ΔE = Ecorr − Epitt. Measurements versus Ag/AgCl (3M KCl).
| Specimen | E1 (V) | Ecorr (V) | icorr (A.cm−2) | Epitt (V) | ipitt (A.cm−2) | Epass (V) | ipass (A.cm−2) | ΔE = Ecorr−Epitt | P.E. % |
| AA 2024 after cleaning and pickling | −0.661 | −0.653 | 1 × 10⁻⁵ | −0.480 | 4 × 10⁻⁴ | −0.615 | 5 × 10⁻⁹ | 0.173 | - |
| SAA 2024 without sealing | −0.593 | −0.625 | 6 × 10⁻⁸ | −0.400 | 3 × 10⁻⁵ | 0.225 | 99.40 | ||
| SAA 2024 with sealing in (Zr/F + Mo) | 0.980 | −0.923 | 2 × 10⁻⁹ | −0.617 | 1 × 10⁻⁸ | −0.850 | 2 × 10⁻⁸ | 0.306 | 99.98 |
| SAA 2024 with sealing in (Zr/F + Ce) | −0.646 | −0.702 | 6 × 10⁻⁹ | −0.702 | − | 0 | 99.94 | ||
| SAA 2024 with sealing in (Zr/F + Mo + Ce) | −1.042 | −0.958 | 2 × 10⁻⁸ | −0.677 | 3.x10−7 | −0.864 | 1 × 10⁻⁷ | 0.281 | 99.80 |
Figure 9a,b show the results from polarization resistance (Rp) measurements of the studied samples, following exposure to a corrosive medium at open circuit potential (Eocp) for 15 min and subsequent polarization with direct current, as well as after preliminary chronoamperometric treatment at the pitting potential (Epitt)—applied during the methodical investigation of current transients in the examined systems. The small differences between the obtained results fall within the expected experimental error range, indicating good repeatability of the tests.
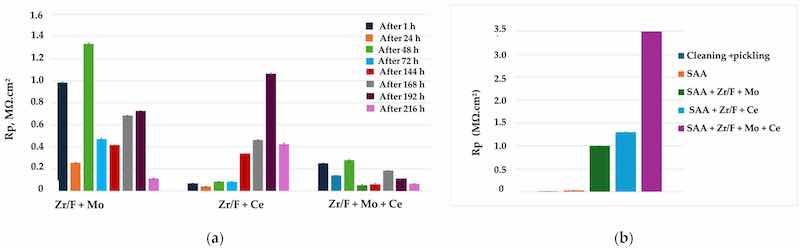
Figure 9. (a) Dependence of the polarization resistance Rp of the studied systems on time of exposure in 0.1 M NaCl, determined at Eocp; (b) variation of the polarization resistance (Rp) of the investigated systems over time during exposure to a corrosive environment (0.1 M NaCl), measured after chronoamperometric treatment at the breakdown potential (Epitt vs. Ag/AgCl (3M KCl)).
The results in Figure 9a show that sample 7 (SAA + Zr/F + Ce) exhibits the highest corrosion resistance (up to 216 h of exposure in the corrosive medium).
When characterizing protection against general corrosion under self-dissolution conditions (at Eocp), the systems can be ranked as follows: Rp (SAA—Zr/F + Mo) > Rp (SAA + Zr/F + Ce).
The Rp results under conditions of externally applied potential close to the pitting potential—i.e., under pitting corrosion conditions (Figure 9b)—allow the systems to be ranked as follows:
Rp (sample 10: SAA + Zr/F + Mo + Ce) > Rp (sample 7: SAA + Zr/F + Ce) > Rp (sample 4: SAA + Zr/F + Mo)
The results—practically the reciprocal of the measured Rp—obtained by establishing the relationship between weight loss and exposure time in the corrosive medium are shown in Figure 10. They illustrate the trend of weight loss as a complex, discrete dependence that characterizes general corrosion over time.
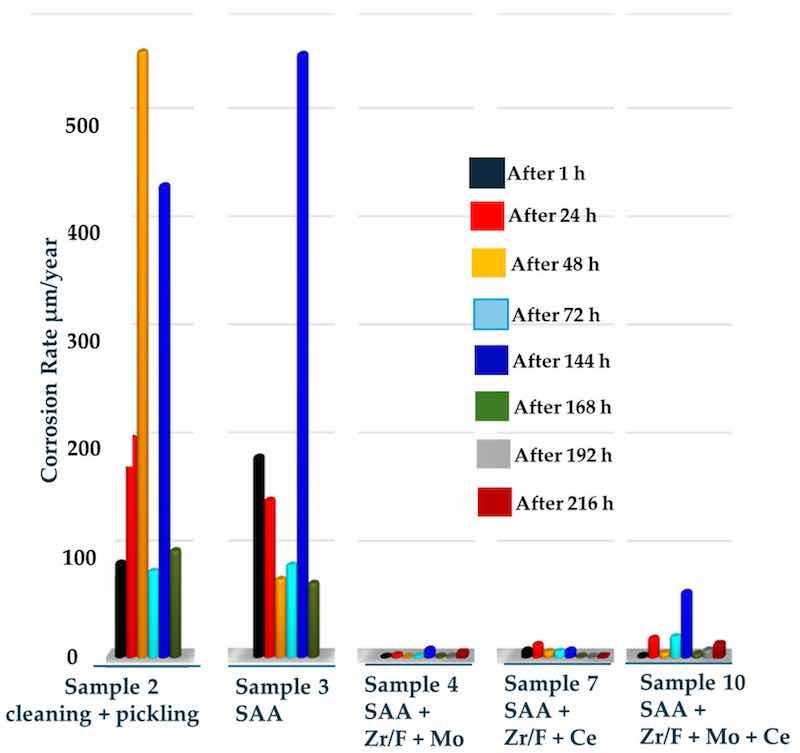
Figure 10. Dependence of the change in dissolution rate (µm/year) of the investigated coatings on the time of exposure in a corrosive medium.
3.3. Surface Characterization via SEM/EDS and XPS
The elemental composition of the AA2024 sheet substrates, determined by EDS analysis, is summarized in Table 8, while the SEM investigations are presented in Figure 11. Typical pretreatment procedures include alkaline degreasing followed by acid pickling or alkaline degreasing followed by both alkaline and acid pickling (Figure 12 and Figure 13a).
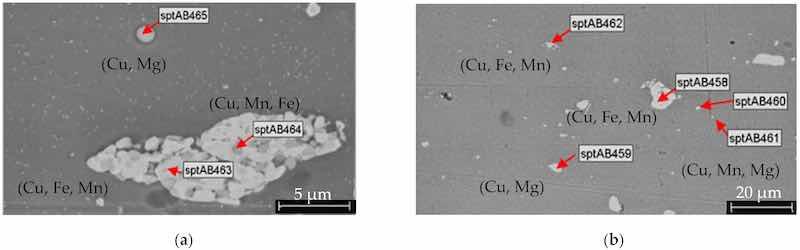
Figure 11. SEM investigations of the AA2024 substrate (without pretreatment and anodization) at different magnifications (a,b). In the BSD detector images, regions with higher atomic numbers appear brighter because heavier elements scatter more electrons. Intermetallic nanoparticles with high concentrations of combinations such as (Cu, Fe, Mn), (Cu, Mg), and (Cu, Mn, Mg) are present on the surface.
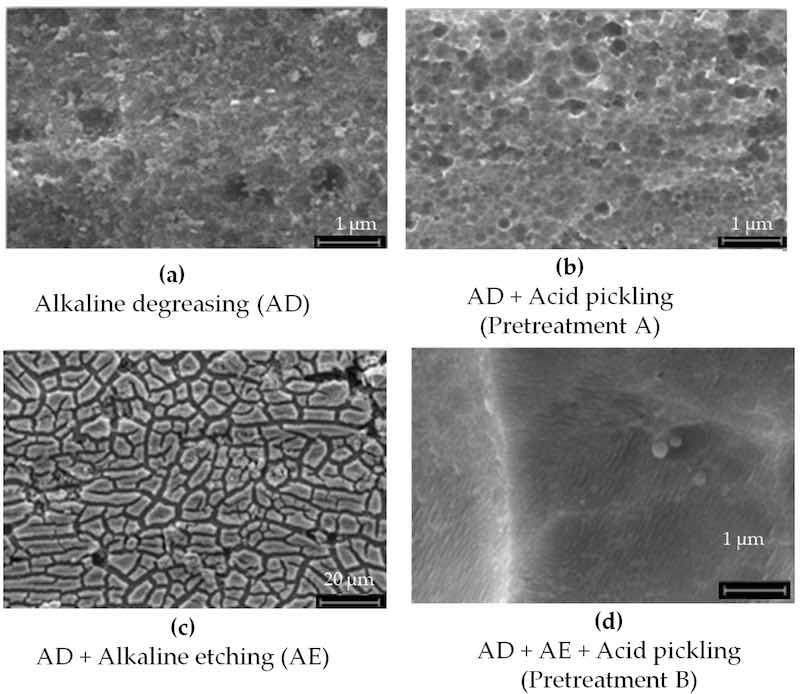
Figure 12. SEM investigations of the aluminum AA2024 substrate (a) after alkaline degreasing with Turco 4215 NCLT for 20 min at 60–65 °C, (b) after alkaline degreasing with Turco 4215 NCLT for 20 min at 60–65 °C and acidic pickling with Turco Smut Go NC 5 min, RT. (c) Alkaline degreasing with Turco 4215 NCLT for 20 min at 60–65 °C and alkaline etching with Aluminetch No. 2 for 1 min at 60 °C; (d) after alkaline degreasing with Turco 4215 NCLT for 20 min at 60–65 °C, alkaline etching with Aluminetch No. 2 for 1 min at 60 °C, and acid pickling with Turco Smut Go NC for 5 min at 40 °C. The weight loss in (d) is 10× that in (b), which is equal to 1.48 g/m2.
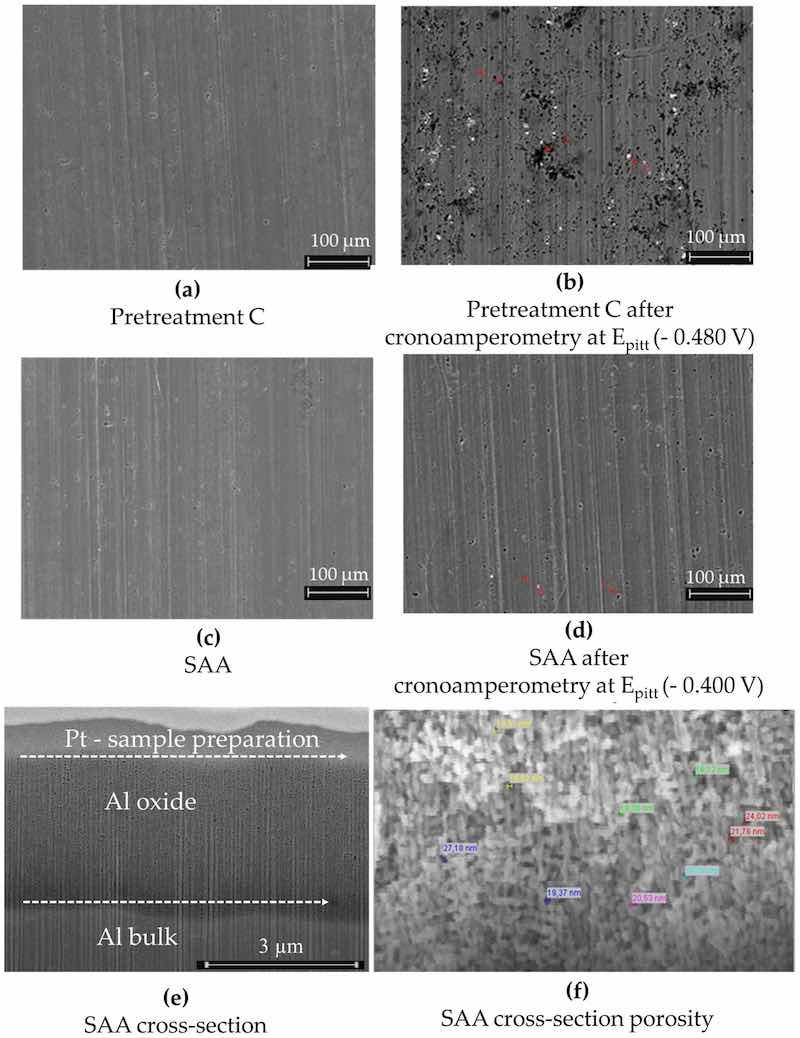
Figure 13. AA2024 (a) after the pretreatment operation C (cleaning, pickling) and (b) after the pretreatment operation C plus chronoamperometry at Epitt = −480 mV with 1 h exposure to 0.1 M NaCl. Bright points indicate regions with higher copper content, while black holes indicate regions with very high copper (86.3 wt%) and manganese (4.8 wt%) levels; (c) only SAA of the AA2024 sample, without sealing; (d) the same SAA sample, without sealing, after chronoamperometry at Epitt = −400 mV; (e) FIB cross-section showing an anodic layer, with a thickness of ca. 4 µm; (f) SEM image of the FIB cross-section. The fracture cross-sections (prepared by cooling the sample in liquid nitrogen) for SAA revealed pore diameters ranging from 17 nm to 29 nm.
Table 8. EDS investigations of AA2024 sheet substrates (Figure 11).
| Element/wt% | AB458 | AB459 | AB460 | AB461 | AB462 | AB463 | AB464 | AB465 |
| Cu | 33.5 | 44.2 | 32.8 | 11.7 | 30.6 | 33.2 | 19.2 | 32.3 |
| Mg | 0.3 | 13.6 | 10 | 0.9 | 0.5 | 0.3 | 0.5 | 10.0 |
| Al | 50.5 | 42.1 | 57.2 | 71.7 | 52.1 | 51.2 | 60.7 | 57.6 |
| Mn | 4.8 | 15.7 | 5.3 | 3.9 | 16.6 | |||
| Fe | 10.9 | 11.52 | 11.4 | 2.9 |
SEM images of the AA2024 aluminum substrate following various pretreatment steps are presented in Figure 12.
Figure 13a–d illustrates the morphological and structural features of AA2024 samples subjected to Pretreatment C—thin sulfuric acid anodization—before and after chronoamperometry at Epitt. The anodic layer in cross-section and the measured porosity are presented in Figure 13e,f.
A comparative analysis of AA2024 SAA surfaces treated with different sealing mixtures, before and after chronoamperometry and 216 h of immersion in NaCl, is shown in Figure 14. When combined, Mo and Ce could be driving overlapping or competitive reactions that result in a denser, more complex sealing layer with reduced surface fluorine exposure (see Figure 14g–i).
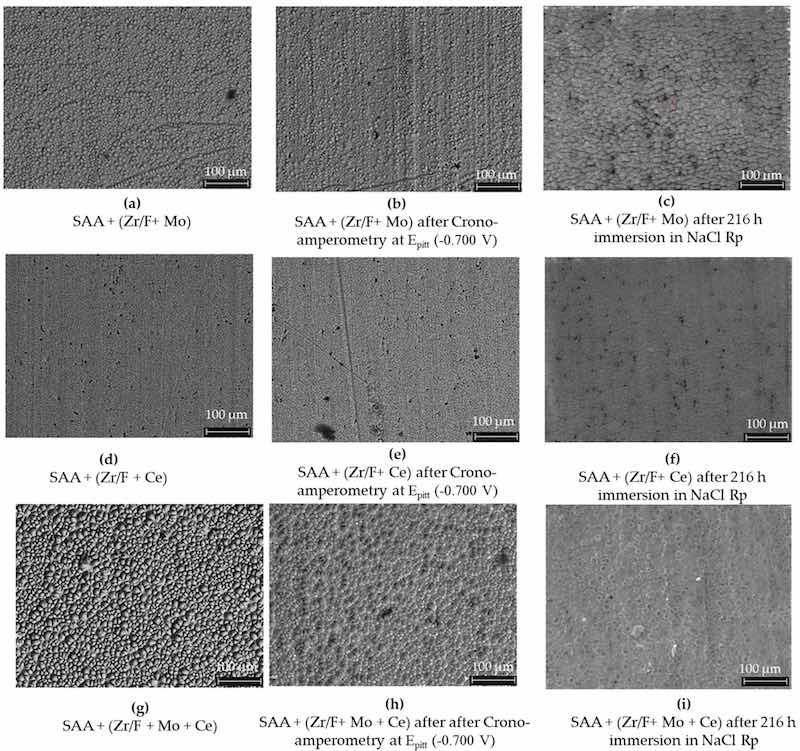
Figure 14. The effects of different sealing mixtures on AA2024 SAA surfaces. In images (a–c), using mixture 1 (Zr/F + Mo), the surface initially showed high levels of F (48.3 wt%), Zr (11.6 wt%), and Mo (2.9 wt%). After chronoamperometry at the pitting potential, F decreased to 19 wt%, while Zr and Mo increased to 25.6 wt% and 6.3 wt%, respectively. Following a 216 h immersion in 0.1 M NaCl, Mo was no longer detectable and Zr increased to 20.77 wt% (XPS data). In images (d–f), a similar SAA sample sealed with mixture 2 (Zr/F + Ce) and undergoing chronoamperometric testing at 0.700 V vs. Ag/AgCl (3M KCl) and subsequent immersion, showing comparable changes. Lastly, images (g–i) illustrate a sample sealed with mixture 3 (Zr/F + Mo + Ce) which initially exhibited higher F (52.6 wt%) and Zr (10.8 wt%) levels along with Mo (1.8 wt%) and Ce (0.1 wt%). Chronoamperometry reduced F to 34.9 wt% and increased Mo to 4.4 wt%, with Ce remaining constant, and immersion led to an increased Zr content similar to the sample without cerium.
Table 9 summarizes the EDS spectra of pretreated AA2024 samples subjected to degreasing and pickling (Pretreatment C), with the untreated alloy used as a reference before and after chronoamperometry at Epitt. The EDS spectra of anodized samples, both before and after chronoamperometry at Epitt, are presented in Table 10.
Table 9. Detection of the EDS spectra of the pretreated samples (degreasing + pickling, pretreatment C, without anodizing and sealing). The AA2024 alloy not subjected to the pretreatment is used as a reference. SEM characterization is shown in Figure 13a,b.
| Detection of the EDS Spectra of the Studied Samples (wt%) | Al | Fe | Si | Cu | Mg | Mn | Cl |
| AA2024—according to the ASTM B211 | 92.4 | 0.5 | 0.5 | 4.4 | 1.6 | 0.6 | |
| AA2024—substrate after pretreatment operations only | 91.7 | 4.7 | 2.7 | 0.9 | |||
| AA2024—the same substrate after chronoamperometry at Epitt (−480 mV); spectrum in white point | 82.6 | 0.6 | 14.1 | 1.9 | 0.7 | 0.1 | |
| AA2024—the same substrate after chronoamperometry at Epitt (−480 mV); spectrum in black hole | 8.9 | 86.3 | 4.8 | ||||
| AA2024—the same substrate after chronoamperometry at Epitt (−480 mV); spectrum in non-cracked surface | 92.6 | 0.2 | 4.1 | 2.5 | 0.5 | 0.1 |
Table 10. Detection of the EDS spectra of the anodized samples without sealing (Figure 13c,d).
| Detection of the EDS Spectra of the Studied Samples (wt%) | Al | Fe | Cu | Mg | Mn |
| Only SAA of the AA2024 sample; without sealing; integral spectrum | 90.5 | 5.1 | 2.5 | 0.8 | |
| The same SAA of the AA2024 sample; without sealing after chronoamperometry at Epitt (−400 mV); spectrum in the hole | 86.4 | 1.2 | 9.7 | 1.2 | 1.5 |
| The same SAA of the AA2024 sample; without sealing after chronoamperometry at Epitt (−400 mV); spectrum in non-cracked surface | 92.4 | 0.2 | 4.3 | 2.5 | 0.6 |
XPS data (in wt%) for AA2024 surfaces, with and without sealing using (Zr/F + Mo), (Zr/F + Ce), and (Zr/F + Mo + Ce) mixtures, are summarized in Table 11.
Table 11. Data from the XPS analysis (wt%), with and without sealing based on (Zr/F + Mo), (Zr/F + Ce), and (Zr/F + Mo + Ce).
| Sample | Si 2p | F 1s | S 2p | O 1s | C 1s | Al 2p | Fe 2p | Cu 2p | Na 1s | Mo 3d | Zr 3d | K 2p | Ce 3d |
| AA2024—substrate after pretreatment operations only and after Rp measurements (sample 2) | 3.37 | 0.63 | 56.6 | 6.23 | 33.17 | ||||||||
| AA2024 + SAA; without sealing (sample 3) | 2.08 | 2.38 | 2.13 | 45.87 | 12.53 | 28.98 | 6.03 | ||||||
| AA2024 + SAA; without sealing (sample 3) after Rp measurements | 3.24 | 0.57 | 63.79 | 4.87 | 27.54 | ||||||||
| AA2024 + SAA + sealing in (Zr/F + Mo) | 0.96 | 26.72 | 6.96 | 16.01 | 4.66 | 8.55 | 4.46 | 3.69 | 11.12 | 16.88 | |||
| AA2024 + SAA + sealing in (Zr/F + Mo) | |||||||||||||
| after Rp measurements | 1.11 | 43.11 | 12 | 23 | 20.77 | ||||||||
| AA2024 + SAA + sealing in (Zr/F + Ce) | 21.6 | 15.95 | 12.39 | 4.29 | 4.16 | 30.39 | |||||||
| AA2024 + SAA + sealing in (Zr/F + Ce) after Rp measurements | 1.97 | 7.07 | 32.83 | 31.78 | 9.34 | 17.01 | |||||||
| AA2024 + SAA + sealing in (Zr/F + Mo + Ce) | 19.54 | 8.3 | 8.97 | 4.87 | 5.12 | 3.67 | 2.71 | 12.6 | 2.3 | ||||
| AA2024 + SAA + sealing in (Zr/F + Mo + Ce) after Rp measurements | 10.89 | 32.89 | 13.69 | 12.56 | 0.22 | 1.55 | 14.81 |
In the early stages, before Rp, the analysis revealed a distinct trend in the zirconium (Zr) surface concentration obtained from the XPS technique. The sample labeled SAA + Zr/F + Ce exhibited the highest Zr 3d signal, with SAA + Zr/F + Mo + Ce following closely, and SAA + Zr/F + Mo trailing behind. In essence, cerium helped to retain a visible layer of zirconium on the surface, whereas molybdenum tended to reduce its apparent concentration (Figure 15).
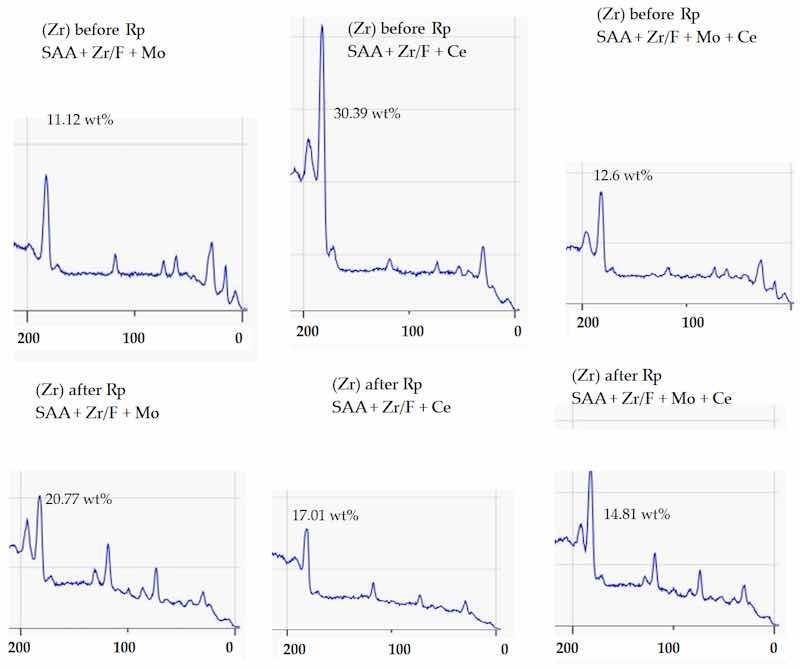
Figure 15. XPS wide scan (200–0 eV) highlighting the Zr 3d region before and after Rp. The Zr 3d doublet appears in the 183–185 eV range, corresponding to oxidized zirconium species.
A higher signal intensity revealed that more fluorine was present on the surface, indicating a zirconium-based fluoride conversion coating. The “F” signal, in particular, suggested the presence of fluoride species such as ZrF62− (Figure 16).
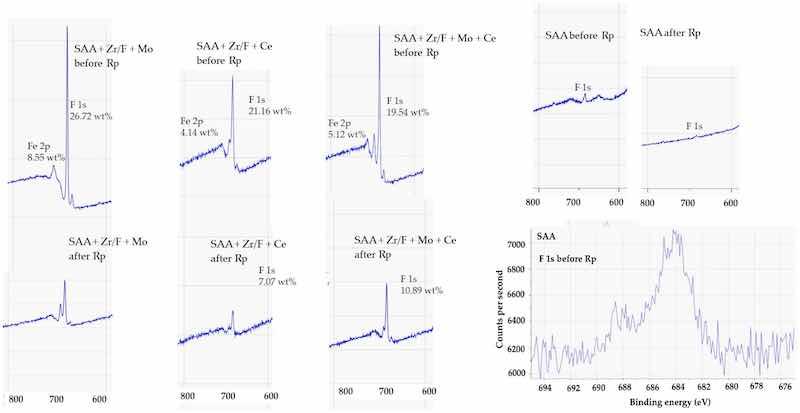
Figure 16. XPS spectrum (800–600 eV) showing the F 1s region. The F 1s peak was observed at approximately 685 eV, indicating the presence of fluorine in the conversion layer.
Before Rp, analysis of the F 1s signal intensity—representing the fluorine surface concentration measured by XPS—showed a clear trend. The SAA + Zr/F + Mo sample exhibited the highest fluorine concentration, followed by SAA + Zr/F + Ce and then SAA + Zr/F + Mo + Ce. The relatively lower F 1s signal in the Mo + Ce composition suggests that fluorine might have been incorporated more deeply into the sealing layer or sub-surface structures. This deeper integration could be indicative of a denser and more stable protective layer, potentially enhancing long-term corrosion resistance (see Figure 9a).
After Rp, the fluorine concentration on the surface generally decreased, a change attributed to film breakdown and ion mobility within the evolving electrochemical environment. The trend now shifted: SAA + Zr/F + Mo + Ce retained the highest fluorine levels, followed by SAA + Zr/F + Ce, while the SAA + Zr/F + Mo sample showed no detectable F 1s signal. These observations suggested that molybdenum might initially help preserve surface fluorine by forming stable Mo-F or Mo-O-F species. In contrast, cerium appeared to promote the formation of cerium-rich oxides that either displaced fluorine or trapped it beneath the surface.
The behavior of molybdenum provided further insights. Before Rp, Mo was more concentrated in the SAA + Zr/F + Mo sample than in the SAA + Zr/F + Mo + Ce composition (Figure 17). This indicates that molybdenum remained more prominent on the surface in the absence of cerium. However, when cerium was co-added, it seemed to interfere with molybdenum deposition—perhaps by promoting a more uniform distribution—and reduced its accumulation at the surface. After Rp, the Mo-only system lost all detectable surface molybdenum entirely, whereas the Mo + Ce system experienced a minor decrease in the Mo concentration (from 2.71 wt% to 1.55 wt%).

Figure 17. XPS spectra (400–200 eV) showing the Mo 3d region. Peaks corresponding to Mo in oxidation states Mo6+ and Mo4+ were observed in the range of 231–233 eV, indicating the presence of mixed molybdenum oxides.
The distinct behavior of cerium was also notable. Cerium was detected exclusively in the SAA + Zr/F + Mo + Ce composition, implying that it does not significantly deposit on the surface when present alone before Rp. This may be due to a different deposition mechanism or limited oxidation to detectable Ce(III)/Ce(IV) states at that stage.
Oxygen levels further illustrated the differences among the systems. In the Mo-only system, a high increase in oxygen content after Rp suggests that the loss of molybdenum exposed zirconium, leading to the formation of oxides such as Al2O3 and ZrO2 (Figure 18). In contrast, the Mo + Ce system exhibited a moderate oxygen increase, implying that some molybdenum and fluorine remained within the film, limiting oxidation. The Ce-only system behaved similarly to the Mo + Ce system, suggesting that the cerium oxide coverage was stable enough to reduce metal exposure and oxygen uptake.
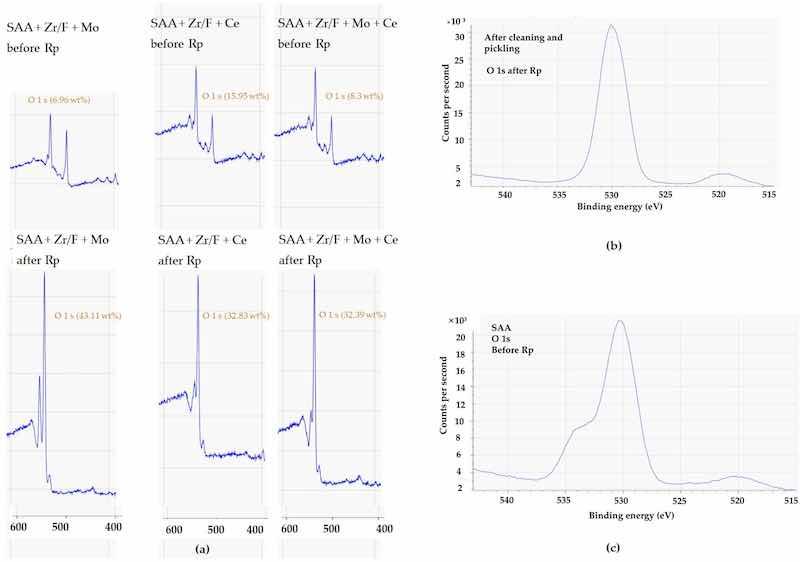
Figure 18. (a) XPS spectra (400–600 eV) before and after Rp for SAA + Zr/F + Mo, SAA + Zr/F + Ce, and SAA + Zr/F + Mo + Ce; (b) XPS spectrum of the O 1s region before anodizing; (c) XPS spectrum of the O 1s region after anodizing.
EDS and XPS analyses of molybdenum provided additional insights. An unexpected increase in molybdenum was observed in the Mo-only system after chronoamperometry, possibly due to Mo species reprecipitating as MoO3 or MoO42− after dissolution, especially under alkaline or neutral conditions. Alternatively, molybdenum may have accumulated near the surface due to changes in the barrier layer, leading to sub-surface enrichment that XPS could not detect. In the Mo + Ce system, while direct EDX measurement of Mo was not available, XPS data confirmed partial retention of molybdenum, aligning with the trend of moderate fluorine loss and controlled zirconium exposure.
Cerium’s role was equally compelling. Across both cerium-containing systems, the cerium content remained very low (0.4 wt% and 0.1 wt%), and these levels did not change after chronoamperometry. This stability confirmed that cerium oxides are chemically robust and not easily leached out during electrochemical testing. The consistency of cerium’s behavior further supported earlier observations from XPS that cerium provides stable surface coverage and contributes significantly to the resilience of the protective film.
Fluorine behavior reinforced the narrative of the protective film’s stability. In the Mo-only system, there was a significant fluorine loss (–29.3 wt%), corroborating the XPS observation that fluorine essentially disappeared after Rp. In contrast, the Mo + Ce system experienced a more minor loss (–17.7 wt%), suggesting a more stable film. The Ce-only system lost the least fluorine (–2.2 wt%), supporting the idea that cerium oxides help anchor fluorine in the film and protect it from leaching.
The interplay between molybdenum and cerium plays a crucial role in determining the chemical and electrochemical stability of the protective film. While molybdenum alone tends to be leached out, the addition of cerium not only stabilizes the film, but also enhances its resistance to oxidation and corrosion by ensuring that key species like fluorine remain effectively integrated within the layer.
Table 12 summarizes the EDS results of anodized AA2024 samples sealed with chromate-free mixtures based on (Zr/F + Mo), (Zr/F + Ce), and (Zr/F + Mo + Ce), following SAA anodization.
Table 12. Chromate-free sealing procedure for the corrosion protection of AA2024 aluminum alloys after SAA anodization. Detection of the EDS spectra of the anodized samples with sealing based on (Zr/F + Mo), (Zr/F + Ce), and (Zr/F + Mo + Ce) sealing. SEM characterization is shown in Figure 14.
| Detection of the EDS Spectra of the Studied Samples (wt%) | Al | Fe | Cu | Mg | Zr | Mn | K | Mo | F | Na | Ce | S |
| AA2024 + sealing in (Zr/F + Mo) | 12.2 | 0.2 | 0.9 | 11.6 | 16.8 | 2.9 | 48.3 | 7.1 | ||||
| AA2024 + sealing in (Zr/F + Mo) after chronoamperometry at Epitt (−700 mV); integral spectrum | 26.8 | 0.1 | 0.9 | 25.6 | 16.3 | 6.3 | 19 | 4.1 | 0.9 | |||
| AA2024 + sealing in (Zr/F + Mo) after chronoamperometry at Epitt (−700 mV; in point | 3.8 | 0.5 | 2.1 | 5 | 1.0 | 0.0 | 87.6 | 0 | 0.0 | |||
| SAA + sealing (Zr/F + Ce) | 17.2 | 0.9 | 57.8 | 1.7 | 2.8 | 19.2 | 2.8 | 0.4 | ||||
| The same sample SAA + sealing (Zr/F + Ce) after chronoamperometry at Epitt (−0.700 V) | 18.8 | 1 | 59.5 | 0.4 | 2.9 | 17 | 2.9 | 0.4 | ||||
| AA2024 + sealing in (Zr/F + Mo + Ce) | 7.7 | 0.2 | 1 | 0.1 | 10.8 | 0.1 | 17.7 | 1.8 | 52.6 | 8 | 0.1 | 0.2 |
| AA2024 + sealing in (Zr/F + Mo + Ce) after chronoamperometry at Epitt (−700 mV); integral spectrum | 13.8 | 0.1 | 1.2 | 0.1 | 22.9 | 0.1 | 15.6 | 4.4 | 34.9 | 5.9 | 0.1 | 1.1 |
The SEM/EDS, XPS, and electrochemical analyses show that the oxide compounds of aluminum, zirconium, and molybdenum play a key role in forming the protective layers on thin-sulfuric-anodized aluminum alloy AA2024. The corrosion resistance (chemical and electrochemical insolubility) of the conversion layers increased when cerium salts (i.e., inclusions of Ce in the conversion layers) were present in the sealing solutions.
3.4. Sealing Comparison: Zr/F/Mo/Ce vs. Hot Water and CrIII/Zr
After the thin SAA anodization process, hot water sealing was conducted at 98 °C for 40 min. The surface morphology, illustrated in Figure 19a, shows a compact anodic oxide layer with well-closed pores, as confirmed by the micrograph in Figure 19b.
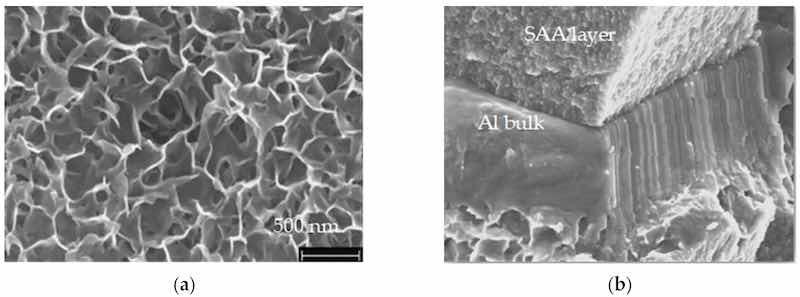
Figure 19. (a) The SEM images of the surface of sealed aluminum samples treated in hot water (98 °C, 40 min) reveal distinctive petal-shaped structures. These formations are indicative of morphological changes likely resulting from the hydration process and the formation of boehmite layers during the sealing treatment; (b) SEM of the fracture cross-sections after sample preparation.
Following 768 h of salt spray testing, the samples sealed with hot water and those sealed in (Zr/F/Mo/Ce) were analyzed for pitting corrosion, as shown in Figure 20a,b. The examination highlights distinct differences in the corrosion behavior of the two sealing treatments, with potential implications for their protective performance under harsh environmental conditions.
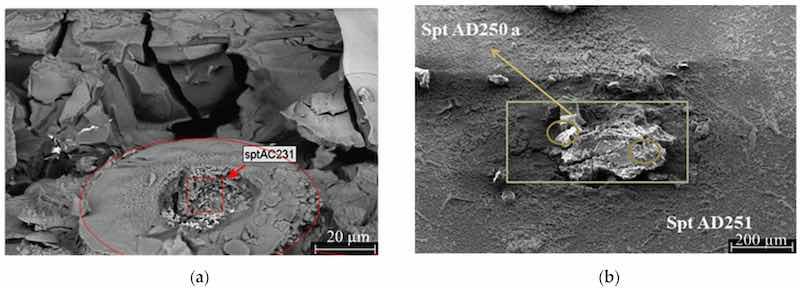
Figure 20. (a) Hot water sealing, after 768 h of SST, pitt analysis: Cu-rich regions were located in and around the pits. EDX analysis (sptAC231) showed the following composition: Cu (9.38 wt%), Cl (12.02 wt%), Al (38.8 wt%), O (36.17 wt%), S (2.45 wt%), and Si (1.67 wt%). (b) Zr/F/Mo/Ce sealing, after 768 SST, pitt analysis (spt AD250a): Mo 11 wt%, Cu 36 wt%, Cl 4 wt%, Al 20 wt%, O 29 wt%: (spt 251): Mo 7 wt%, Cu 4 wt%, Cl 7 wt%, Al 33 wt%, O 49 wt%.
The presence of high Cu (9.38 wt%) and Cl (12.02 wt%) concentrations in and around the pits suggests the formation of localized galvanic cells, where copper acts as a cathodic battery electrode, accelerating the corrosion of the surrounding aluminum. Chloride ions further contribute to pit propagation, leading to severe localized degradation. Molybdate (MoO42−), like chromate (CrO42−), has a reducible hexavalent anion, forming an insoluble oxide and acting as a corrosion inhibitor with properties most similar to chromate. The detection of molybdenum (7–11 wt%) at pit sites in Zr/F/Mo/Ce-sealed samples is noteworthy. Molybdenum compounds are known to inhibit corrosion by forming protective surface layers that limit electrochemical activity within pits. The lower Cu and Cl concentrations compared to the hot-water-sealed sample suggest that the Zr/F/Mo/Ce system mitigates chloride-induced corrosion to some extent. Additionally, the increased oxygen content (up to 49 wt%) may indicate the formation of stable oxide layers contributing to enhanced corrosion resistance.
Figure 21 shows the surface appearance of samples sealed with (Zr/F + Mo + Ce) at room temperature, compared to those treated with a commercial Chrom(III)-based sealing product (Alodine 5923 P) and hot water sealing, after 768 h of salt spray testing.
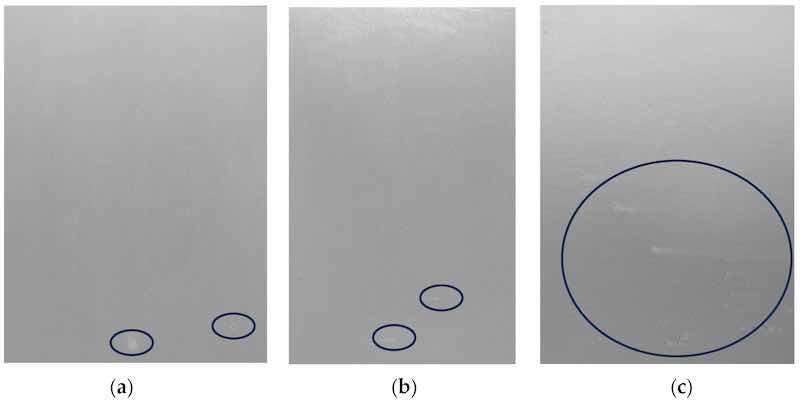
Figure 21. Results from 768 h of SST: SAA 5 µm. (a) SAA Zr/F + Mo + Ce (RT), (b) SAA + Cr(III)/Zr (RT)—commercial product (Alodine 5923 P), (c) SAA + HTS (98 °C). The circles in the figure highlight the pits that appeared after testing in SST.
The results of the salt spray test (SST), focusing on surface examination to determine the number of pits in the thin SAA layer (4.5 µm) with sealing, are summarized in Table 13.
Table 13. Results of the SST for thin SAA (4.5 µm) with sealing.
| Ranking | Surface Examination | Sealing Composition |
| 1 | No pits | - |
| 2 | One to five pits | SAA + (Zr/F + Mo + Ce); SAA + (Cr(III)/Zr) |
| 3 | Six to ten pits | - |
| 4 | 11–30 pits | SAA + (HTS 98 °C) |
The proposed mechanism of corrosion protection is depicted in Figure 22. The small differences between the obtained results fall within the expected experimental error range, indicating good repeatability of the tests.
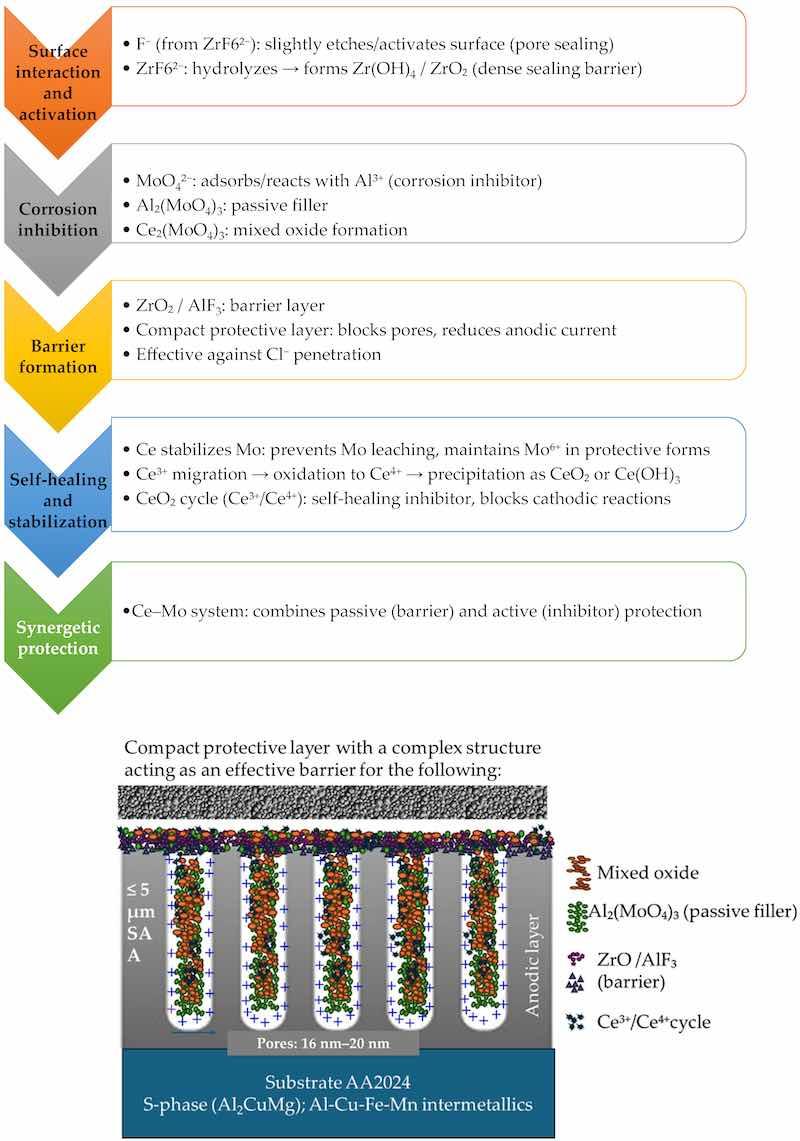
Figure 22. Corrosion protection mechanism.
3.5. Environmental and Economic Study of SAA Anodization with Chromium-Free Sealing Based on Fluorozirconate, Molybdate, and Cerate Compared to CAA with Cr(VI) Sealing and SAA with Cr(III) Sealing
Aircraft manufacturers face the challenge of achieving up to a 30-year operational lifespan, even though alternative anodizing technologies, especially those with chromium-free sealing, lack extensive long-term field data compared to Cr(VI)-based systems [40]. Recent studies indicate that differences in water consumption and Cr(VI) emissions between anodized and non-anodized processes are minimal, and sulfuric acid emissions during anodizing are very low [40,41]. While the raw material costs of sulfuric acid anodizing (SAA) are generally comparable to or lower than those of chromic acid anodizing (CAA), the environmental impact of SAA is largely determined by the sealing process. For example, sealing with hydrogen peroxide requires tight process controls and integrated cooling to minimize evaporation, thereby increasing operational costs. Conversely, SAA waste treatment is often simplified by eliminating the chromate reduction process, and overall costs for personal protective equipment and utilities are similar between thin-SAA and CAA [1]. Energy consumption data for CAA [40] highlight significant environmental impacts: 88.5 MJ/m2 of thermal energy and 3.5 kWh/m2 of electrical energy, with major contributions from energy use, waste, CO2 emissions, atmospheric emissions, and water consumption. Optimization of bath lifespan and operating temperatures is key to reducing these impacts.
In this study, the processes for thin SAA and the development of green, chromium-free sealing were scaled to 20,000 L baths per step. European energy prices were incorporated into the cost analysis, using a rate of EUR 0.1558 per kWh for non-residential consumers and an EU average of EUR 0.0616 per kWh based on 2023 consumption data [42,43]. Heating energy consumption was estimated by calculating the specific heat capacity for each solution composition—using 4.18 kJ/(kg C) for water and adjusted values for degreasing, pickling, anodizing, and sealing solutions—assuming an 85% efficiency. Identical calculations were performed for both SAA with Cr(III) sealing and SAA with the newly developed Cr(VI)- and Cr(III)-free sealing. The results, which compare heating energy consumption and associated costs, are presented in Figure 23 using the parameters detailed in Table 14.
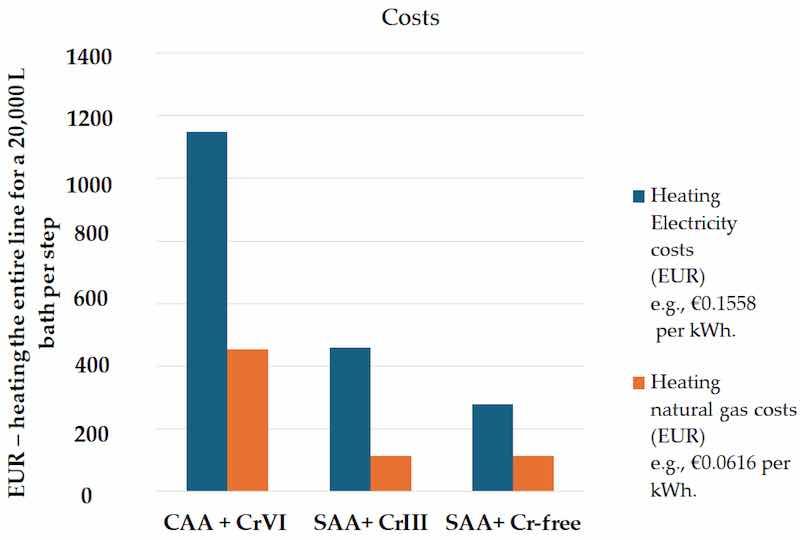
Figure 23. Heating costs (EUR) for a 20,000 L bath in three processes: CAA + Cr(VI), SAA + Cr(III) sealing, and SAA + Cr-free sealing.
Table 14. Parameters used for the estimation of the heating costs for each step in the anodizing line.
| Pretreatment | Anodization | Sealing |
| Pretreatment A | CAA | Cr(VI) |
| Degreasing: 60 °C; 20 min | 40 °C | 100 °C |
| Pickling: 55 °C; 7 min | 45 min | 30 min |
| Pretreatment C | SAA | Cr(III) |
| Degreasing: 55 °C; 20 min | 19 °C | Step 1: 45 °C; 12 min |
| Pickling: 55 °C; 10 min | 22 min | Step2: 35 °C; 7 min |
| Pretreatment C | SAA | Cr-free |
| Degreasing: 45 °C; 20 min | 19 °C | 25 °C |
| Pickling: 55 °C; 10 min | 22 min | 15 min |
Table 15 presents the ecological evaluation of Cr(VI) sealing compared to sealing with mixture 1 and mixture 2.
Table 15. Ecological evaluation Cr(VI) sealing and sealing with mixture 1 and 2. Substance information source: substance information—ECHA [41].
| Cr(VI)—Sealing EC/List No. 231-906-6 | K2Zr2F6 EC/List No.: 240-985-6 | Na2MoO4·2H2O | Ce(NO3)3·6H2O EC/List No.: 600-370-9 |
| Danger! According to the harmonized classification and labeling (CLP00) approved by the European Union; this substance is fatal if inhaled; toxic if swallowed; causes severe skin burns and eye damage; may cause genetic defects; may cause cancer; may damage fertility and may damage the unborn child; causes damage to organs through prolonged or repeated exposure; is very toxic to aquatic life; with long lasting effects; may intensify fire (oxidizer); is harmful in contact with the skin; may cause an allergic skin reaction; and may cause allergy or asthma symptoms or breathing difficulties if inhaled. Additionally; the classification provided by companies to ECHA in REACH registrations identifies that this substance may damage fertility or the unborn child; is suspected of causing genetic defects; is suspected of causing cancer; and may cause respiratory irritation. | Danger! According to the classification provided by companies to ECHA in REACH registrations this substance is toxic if swallowed and causes serious eye damage. | Not an hazardous substance | Danger! According to the classification provided by companies to ECHA in CLP notifications this substance is very toxic to aquatic life with long lasting effects; causes serious eye damage; may intensify fire (oxidizer); and causes skin irritation. |
| Included in Annex VI of REACh 024-002-00-6 | Not included in Annex VI of REACh data | Not included in Annex VI of REACh | Not included in Annex VI of REACh |
4. Discussion of the Results of Sealing Based on Fluorozirconate, Molybdate, with and Without Cerate
4.1. Discussion of the Results from Sealing with Mixture 1 Based on Fluorozirconate and Molybdate (Zr/F + Mo)
The results obtained for sample 4 (Zr/F + Mo) following the measurement of Rp indicate that, after 216 hr at Eocp, the top part of the conversion layer (up to ~5 nm in thickness) contained only Zr and at an increased concentration (20.77 wt%) from XPS analysis. The remaining characteristic elements of the conversion layer (Mo, F, K, Na, S, Fe) that were detected in the as-deposited sample were apparently present at lower depths of the conversion layer (exceeding 5 nm—the limit of detection of the XPS method), taking into account the EDS analysis for the sample with (Zr/F + Mo). A similar effect was established for sample No. 7 (Zr/F + Ce).
The process of sealing in (Zr/F + Mo) significantly impacts the corrosion potential of the studied sample, shifting it into a negative direction by about 300 mV (from −0.625 V to −0.923 V). The corrosion current decreased by about three orders of magnitude compared to the value established for the SAA of AA2024. This fact points to cathodic inhibition of the corrosion process due to the formed conversion layer containing Zr, F, and Mo. There was a marked decrease in anodic currents as well as the appearance of a passive zone with passive current values of about 2 × 10⁻⁸ A.cm−2. The obtained corrosion currents and potentials make us conclude that the “Al2O3/conversion film” system formed on top of AA2024 is an effective barrier to the corrosion process of the aluminum surface in 0.1 M NaCl. In this case, we also observed a considerable shift in the corrosion potential from the breakdown potential (Epitt) of the Al/conversion layer system.
It is known that the anodic treatment itself considerably improves the corrosion resistance of the anodized alloy. However, alloying elements—Cu, Mg, Mn, and Fe—were present as intermetallic compounds/phases in the AA2024 alloy that we investigated: Al2Cu, Al2CuMg (S phase), Al7Cu2Fe7, and Al20Cu2Mn3 are difficult to anodize, leading to inhomogeneous anodic films with decreased protective ability.
Specifically, the applied method of sealing (the pores) of the anodic film also led to the formation of a dense protective layer on the anodic surface and the establishment of a corrosion potential for the system that is more negative than the breakdown potential (Epitt) of the S phase (Epit = −0.550 V). Therefore, we can claim that the corrosion process for this type of sealing is general. The chronoamperometric investigations (at a potential close to the potential of pitting formation for the system) registered cathodic currents during the explored time interval. This indicates an ongoing reduction process, i.e., the transition of a component of the mixed conversion layer from a higher to a lower valency, which, upon consideration, may lead to its dissolution. This statement is supported by the EDS results prior to and following the chronoamperometric measurement. The change in the surface concentration of the components, most pronounced for the point analysis, indicates a local character to the cathodic currents, with subsequent anodic dissolution in certain areas. The lack of local anodic currents indicates that the corrosion process had not penetrated the barrier component of the oxide film to reach the aluminum substrate, specifically the S phase of the aluminum matrix in AA2024.
4.2. Discussion of the Results of Sealing with Mixture 2 Based on Fluorozirconate, Molybdate, and Cerate (Zr/F + Mo + Ce)
For this sample, the corrosion potential also shifted in the negative direction (compared to the corrosion potential of sample No. 3—SAA AA2024) by about 0.300 V. In this case, the formed conversion layer also formed an effective barrier against the anodic reaction of the corrosion process. A passive behavior of the system was observed, with values of the passive current of ~1 × 10⁻⁷A/cm2. This result may be associated with the compact structure of the conversion layer. We can conclude that, regardless of the ongoing corrosion processes, this sealing technique effectively blocks the pores of the anodic oxide layer on AA2024, as a result of which the aggressive components of the corrosion medium do not reach the aluminum substrate. This statement is supported by the extremely low anodic currents registered during chronoamperometric investigations of sample No. 10. It is also obvious that, at these current transients (a potential close to the breakdown potential of pitting formation), only insignificant current oscillations were observed, characteristic of pitting corrosion (corrosion penetration of the conversion layer reaching the aluminum substrate).
5. Conclusions
The developed chromium-free sealing procedure, using a mixture of fluorozirconate, molybdate, and cerate, demonstrated promising results regarding both performance and environmental impact. The anodized and sealed aluminum in sulfuric acid exhibited excellent corrosion resistance after 768 h of salt spray testing, with minimal pit formation. The Zr/F, Mo, and Ce-based sealing performance was comparable to commercial chromium III-based sealing systems and surpassed traditional hot water sealing methods.
An environmental and economic study highlighted the environmental benefits of replacing chromium-based anodizing and sealing processes with alternatives like Zr/F-, Mo-, and Ce-based sealing. The energy consumption and heating costs associated with the three procedures (Cr(VI) sealing, Cr(III) sealing, and Cr-free sealing) demonstrated significant improvements with the Cr-free sealing.
This case study demonstrates that using thin SAA (≤5 µm) and a chromate-free sealing system based on Zr/F, Mo, and Ce holds great potential for reducing environmental impacts.
Future perspectives of the present work should focus on optimizing process parameters, scaling for industrial applications, conducting long-term performance studies, integrating it with sustainable manufacturing, and benchmarking it against emerging eco-friendly sealing technologies to enhance durability, efficiency, and environmental benefits.
Written by Norica Godja 1,2 and Florentina-Daniela Munteanu1,3
1 Interdisciplinary School of Doctoral Studies, “Aurel Vlaicu” University of Arad, 2-4 E. Drăgoi Str., 310330 Arad, Romania; 2 Bionanotec, Surface Technology & Sensors, Sperkerriegel 30, 2811 Wiesmath, Austria; 3 Faculty of Food Engineering, Tourism and Environmental Protection, “Aurel Vlaicu” University of Arad, 2-4 E. Drăgoi Str., 310330 Arad, Romania
Author Contributions: Conceptualization, N.G.; methodology, N.G. and F.-D.M.; investigation, N.G; data curation, N.G.; writing—original draft preparation, N.G.; writing—review and editing, F.-D.M.; supervision, F.-D.M. All authors have read and agreed to the published version of the manuscript.
Funding: This research received no external funding.
Institutional Review Board Statement: Not applicable.
Informed Consent Statement: Not applicable.
Acknowledgments: We gratefully acknowledge the valuable support provided by D. Stoychev, Bulgarian Academy of Sciences, for his partial contributions to the characterization and electrochemical measurements. His guidance and contributions have significantly enhanced the quality of our research.
Conflicts of Interest: Norica Godja was employed by the company Bionanotec. The remaining author declares that the research was conducted in the absence of any commercial or financial relationships that could be construed as a potential conflict of interest.
Abbreviations
The following abbreviations are used in this manuscript:
- CAA: Chromic acid anodizing
- CeCCs: Cerium-based coatings
- EASA: European Union Aviation Safety Agency
- Ecorr: Corrosion potential
- EDX: Energy-dispersive X-ray spectroscopy
- FAA: Federal Aviation Administration
- TSAA: Sulfuric acid and tartaric acid
- icorr: Corrosion current
- IMPs: Intermetallic compounds
- ipass: Current at passivity area
- ipitt: Current at breakdown potential
- REACH: Registration, evaluation, authorisation, and restriction of chemicals
- SAA: Sulfuric acid anodizing
- SEM/FIB: Scanning electron microscope/focused ion beam
- SST: Salt spray test
- XPS: X-ray photoelectron spectroscopy
References
- The Boeing Company. Socio-Economic Analysis Complete Version; Boeing Distribution, Inc.: Miami, FL, USA, 2022. [Google Scholar]
- Li, S.; Yue, X.; Li, Y.; Peng, L. Development and applications of aluminum alloys for aerospace industry. J. Mater. Res. Technol. 2023, 27, 944–983. [Google Scholar] [CrossRef]
- Pantelakis, S.; Tserpes, K. Revolutionizing Aircraft Materials and Processes. Springer Nature: Berlin, Germany, 2020. [Google Scholar]
- Ofoegbu, S.U.; Fernandes, F.A.O.; Pereira, A.B. The Sealing Step in Aluminum Anodizing: A Focus on Sustainable Strategies for Enhancing both Energy Efficiency and Corrosion Resistance. Coatings 2020, 10, 226. [Google Scholar] [CrossRef]
- Donati, L.; Vincenzi, F.; Vincenzi, F.; Barba, W.D.; Tomesani, L. Borate Free Cleaners for Aluminum Alloys. Mater. Today Proc. 2015, 2, 5080–5087. [Google Scholar] [CrossRef]
- Gharbi, O. In-Situ Investigation of Elemental Corrosion Reactions During the Surface Treatment of Al-Cu and Al-Cu-Li Alloys. Ph.D. Thesis, Sorbonne University, Paris, France, 2018. Available online: https://theses.hal.science/tel-01535612 (accessed on 7 February 2025).
- Kosari, A.; Tichelaar, F.; Visser, P.; Zandbergen, H.; Terryn, H.; Mol, J.M.C. Dealloying-driven local corrosion by intermetallic constituent particles and dispersoids in aerospace aluminium alloys. Corros. Sci. 2020, 177, 108947. [Google Scholar] [CrossRef]
- Abrahami, S.T.; Kok, J.M.M.D.; Terryn, H.; Mol, J.M.C. Towards Cr(VI)-free anodization of aluminum alloys for aerospace adhesive bonding applications: A review. Front. Chem. Sci. Eng. 2017, 10, 465–482. [Google Scholar] [CrossRef]
- Beck, E. Performance Validation of Thin-Film Sulfuric Acid Anodization (TFSAA) on Aluminum Alloys. AESF/EPA Conf. Environ. Process Excell. 2003, 339–356. Available online: https://www.nmfrc.org/pdf/awk03/aw03o01.pdf (accessed on 11 February 2025).
- Martinez-Viademonte, M.P.; Abrahami, S.T.; Havigh, M.D.; Marcoen, K.; Hack, T.; Burchardt, M.; Terryn, H. The Role of Anodising Parameters in the Performance of Bare and Coated Aerospace Anodic Oxide Films. Coatings 2022, 12, 908. [Google Scholar] [CrossRef]
- Jo, H.; Lee, S.; Kim, D.; Lee, J. Low Temperature Sealing of Anodized Aluminum Alloy for Enhancing Corrosion Resistance. Materials 2020, 13, 4904. [Google Scholar] [CrossRef]
- Wang, Q.; Li, H. Study on anodic oxidation of 2099 aluminum lithium alloy and sealing treatment in environmental friendly solutions. Int. J. Electrochem. Sci. 2023, 18, 100186. [Google Scholar] [CrossRef]
- Yang, K.; Yang, F. Enhancing Corrosion Resistance of Anodic Oxide Films through Zirconium and Titanium Salts Composite Sealing Process: An Optimization and Morphological Study. Res. Sq. 2023. [Google Scholar] [CrossRef]
- Zhan, W.; Li, Y.; Wang, W.; Wang, D.; Liu, X.; Ding, Y.; Qian, X. Study of titanium/zirconium with low polymerization water-based epoxysilane composite chemical conversion coatings on multi-metals bodies of new energy vehicles. Prog. Org. Coat. 2025, 200, 109023. [Google Scholar] [CrossRef]
- Peltier, F. Review of Cr-Free Coatings for the Corrosion Protection of Aluminum Aerospace Alloys. Coatings 2022, 12, 518. [Google Scholar] [CrossRef]
- Frankel, G.S.; Buchheit, R.G.; Jaworowski, M.; Greg, S. Scientific Understanding of Non-Chromated Corrosion Inhibitors Function; SERDP Project WP-1620; 2013. Available online: https://apps.dtic.mil/sti/tr/pdf/ADA582500.pdf (accessed on 11 February 2025).
- Chidambaram, D.; Clayton, C.R.; Halada, G.P. The role of hexafluorozirconate in the formation of chromate conversion coatings on aluminum alloys. Electrochim. Acta 2006, 51, 2862–2871. [Google Scholar] [CrossRef]
- Hao, X.-L. Nickel-free sealing technology for anodic oxidation film of aluminum alloy at room temperature. Rare Met. 2020, 40, 968–974. [Google Scholar] [CrossRef]
- Záchenská, J.; Jorík, V.; Madejová, J.; Zemanová, M. Fluorozirconate sealing of anodic alumina in alkaline environment. Solid State Ion. 2023, 391, 126126. [Google Scholar] [CrossRef]
- Zhu, P.; Ma, Y.; Li, K.; Liang, Z.; Yang, B.; Huang, W.; Liao, Y. Sealing of anodized AA2099-T83 Al-Cu-Li alloy with layered double hydroxides for high corrosion resistance at reduced anodic fi lm thickness. Surf. Coat. Technol. 2020, 394, 125852. [Google Scholar] [CrossRef]
- Wei, H.; Chen, D.; Hu, H.; Chang, M.; Ye, X.; Wang, M. Insights into energy-efficient and eco-friendly sealing of anodic aluminum oxide film holes with alkaline earth metal salts. RCS Adv. 2017, 7, 55653–55667. [Google Scholar] [CrossRef]
- Carrillo, I.; Valdez, B.; Zlatev, R.; Stoytcheva, M.; Carrillo, M.; Baffler, R. Electrochemical study of oxyanions effect on galvanic corrosion inhibition. Int. J. Electrochem. Sci. 2012, 7, 8688–8701. [Google Scholar] [CrossRef]
- Krishnan, C.V.; Garnett, M.; Hsiao, B.; Chu, B. Electrochemical Measurements of Isopolyoxomolybdates: 1. pH Dependent Behavior of Sodium Molybdate. Int. J. Electrochem. Sci. 2007, 2, 29–51. [Google Scholar] [CrossRef]
- Zhu, H.; Li, J. Advancements in corrosion protection for aerospace aluminum alloys through surface treatment. Int. J. Electrochem. Sci. 2024, 19, 100487. [Google Scholar] [CrossRef]
- Kendig, M.W.; Buchheit, R.G. Corrosion Inhibition of Aluminum and Aluminum Alloys by Soluble Chromates, Chromate Coatings, and Chromate-Free Coatings. Corrosion 2003, 59, 379–400. [Google Scholar] [CrossRef]
- Oleinik, S.V.; Kuznetsov, Y.I. Corrosion Inhibitors in Conversion Coatings. IV. Prot. Met. 2007, 43, 391–397. [Google Scholar] [CrossRef]
- Qian, X.; Huang, F.; Teng, X.; Wang, Y.; Fang, Y.; Pan, J.; Wang, W.; Li, Y.; Zhan, W. The Preparation, Corrosion Resistance and Formation Mechanism of a New-Type Mo-Based Composite Conversion Coating on 6061 Aluminum Alloy. Metals 2023, 13, 168. [Google Scholar] [CrossRef]
- Chidambaram, D.; Rodriguez, D. Molybdate-Based Conversion Coatings for Aluminum Alloys Part II: Coating Chemistry. Trans. E C S Soc. Electrochem. 2013, 45, 91–103. [Google Scholar] [CrossRef]
- Pinheiro, J.S.; Cardoso, H.R.P.; Pereira, K.R.; Radtke, C.; Kunst, S.; Oliveira, C.T.; Zoppas Ferreira, J. Chromium/nickel-free conversion coating as cold post-treatment to anodized AA2024-T3 for corrosion resistance increase. Surf. Coat. Technol. 2024, 480, 130566. [Google Scholar] [CrossRef]
- Li, Z.; Visser, P.; Hughes, A.E.; Homborg, A.; Gonzalez-garcia, Y.; Mol, A. Review of the state of art of Li-based inhibitors and coating technology for the corrosion protection of aluminium alloys. Surf. Coat. Technol. 2024, 478, 130441. [Google Scholar] [CrossRef]
- Milosev, I. Corrosion inhibition of aluminium alloys by molybdate ions: A critical review of the chemistry, mechanisms and applications. Corros. Sci. 2024, 229, 111854. [Google Scholar] [CrossRef]
- Lau, D.; Glenn, A.M.; Hughes, A.E.; Scholes, F.H.; Muster, T.H.; Hardin, S.G. Factors in fluencing the deposition of Ce-based conversion coatings, Part II: The role of localised reactions. Surf. Coat. Technol. 2009, 203, 2937–2945. [Google Scholar] [CrossRef]
- Buchheit, R.G.; Mamidipally, S.B.; Schmutz, P.; Guan, H. Active Corrosion Protection in Chromate and Chromate-Free Conversion Coatings. Corrosion 2002, 58, 3–14. [Google Scholar] [CrossRef]
- Galvn, J.J.A.; Rovira, L.G.; Bethencourt, M.; Botana, F.J.; Amaya, J.M.S. Influence of aerospace standard surface pretreatment on the intermetallic phases and cecc of 2024-t3 al-cu alloy. Metals 2019, 9, 320. [Google Scholar] [CrossRef]
- Sainis, S.; Roșoiu, S.; Ghassemali, E.; Zanella, C. The role of microstructure and cathodic intermetallics in localised deposition mechanism of conversion compounds on Al (Si, Fe, Cu) alloy. Surf. Coat. Technol. 2020, 402, 126502. [Google Scholar] [CrossRef]
- Carangelo, A.; Curioni, M.; Acquesta, A.; Monetta, T.; Bellucci, F. Cerium-Based Sealing of Anodic Films on AA2024T3: Effect of Pore Morphology on Anticorrosion Performance. J. Electrochem. Soc. 2016, 163, C907. [Google Scholar] [CrossRef]
- Moutarlier, V.; Gigandet, M.P.; Richard, J.P.; Brault, C.; Pagetti, J. Utilisation de Molybdate Dans un Procede de Colmatage d’une Couche D’oxyde Obtenue Par Anodisation D’Aluminium. EP1464733A1, 6 October 2004. [Google Scholar]
- Rossignol, C.; Vialas, N. Process for Treating the Surface of a Part Made of Aluminium or Aluminium Alloy or of Magnesium or Magnesium Alloy. US2021262107A1, 14 June 2019. [Google Scholar]
- Yang, H.; Dong, Y.; Li, X.; Gao, Y.; He, W.; Liu, Y.; Mu, X.; Zhao, Y. Anti-corrosion superhydrophobic micro-TiB2/nano-SiO2 based coating with “multi-scale hard particles-embedding-soft membrane” structure fabricated by spray deposition. J. Ind. Eng. Chem. 2025, 144, 496–511. [Google Scholar] [CrossRef]
- Harscoet, E.; Froelich, D. Use of LCA to evaluate the environmental benefits of substituting chromic acid anodizing (CAA). J. Clean. Prod. 2008, 16, 1294–1305. [Google Scholar] [CrossRef]
- Schulte, S.R. Anodizing Emission Rates. Available online: https://www.pfonline.com/articles/anodizing-emission-rates (accessed on 14 March 2025).
- Eurostat. Electricity Prices for Non-Household Consumersa—Bi-Annual Data (from 2007 Onwards); European Commission: Brussels, Belgium; Available online: https://ec.europa.eu/eurostat/databrowser/view/nrg_pc_205/default/table?lang=en (accessed on 14 March 2025).
- Eurostat. NATURAL Gas Prices for Non-Household Consumers; European Commission: Brussels, Belgium; Available online: https://ec.europa.eu/eurostat/statistics-explained/index.php?title=Natural_gas_price_statistics#:~:text=The (accessed on 14 March 2025).